Estimated Value: $204,786
--
Bed
2
Baths
1,208
Sq Ft
$170/Sq Ft
Est. Value
About This Home
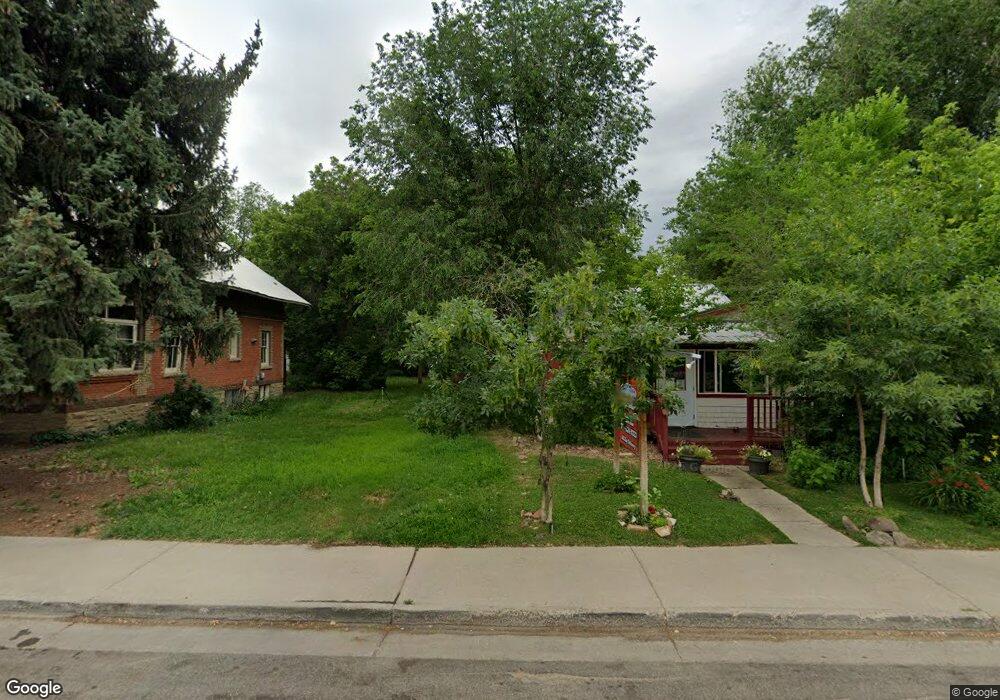
This home is located at 572 Breeze St, Craig, CO 81625 and is currently estimated at $204,786, approximately $169 per square foot. 572 Breeze St is a home located in Moffat County with nearby schools including Sunset Elementary School, Moffat County High School, and Calvary Baptist School.
Ownership History
Date
Name
Owned For
Owner Type
Purchase Details
Closed on
Jun 1, 2020
Sold by
Hubler Jeffrey A
Bought by
Belcher Stephen Joseph
Current Estimated Value
Home Financials for this Owner
Home Financials are based on the most recent Mortgage that was taken out on this home.
Original Mortgage
$75,400
Outstanding Balance
$60,136
Interest Rate
3.3%
Mortgage Type
Commercial
Estimated Equity
$144,650
Purchase Details
Closed on
Jul 23, 2018
Sold by
Hubler Charles D
Bought by
Hubler Jeffrey A
Purchase Details
Closed on
Mar 30, 2018
Sold by
Hubler Charles D
Bought by
Hubler Jeffrey A
Purchase Details
Closed on
Jan 18, 2008
Sold by
Lawson Joshua H
Bought by
Hubler Jeffrey A and Hubler Charles D
Home Financials for this Owner
Home Financials are based on the most recent Mortgage that was taken out on this home.
Original Mortgage
$220,000
Interest Rate
5.94%
Mortgage Type
Unknown
Create a Home Valuation Report for This Property
The Home Valuation Report is an in-depth analysis detailing your home's value as well as a comparison with similar homes in the area
Home Values in the Area
Average Home Value in this Area
Purchase History
| Date | Buyer | Sale Price | Title Company |
|---|---|---|---|
| Belcher Stephen Joseph | $150,800 | Abstract & Title Co | |
| Hubler Jeffrey A | -- | None Available | |
| Hubler Jeffrey A | -- | None Available | |
| Hubler Jeffrey A | $275,000 | None Available |
Source: Public Records
Mortgage History
| Date | Status | Borrower | Loan Amount |
|---|---|---|---|
| Open | Belcher Stephen Joseph | $75,400 | |
| Previous Owner | Hubler Jeffrey A | $220,000 |
Source: Public Records
Tax History Compared to Growth
Tax History
| Year | Tax Paid | Tax Assessment Tax Assessment Total Assessment is a certain percentage of the fair market value that is determined by local assessors to be the total taxable value of land and additions on the property. | Land | Improvement |
|---|---|---|---|---|
| 2024 | $2,615 | $30,144 | $0 | $0 |
| 2023 | $2,615 | $30,144 | $25,110 | $5,034 |
| 2022 | $3,265 | $38,730 | $24,800 | $13,930 |
| 2021 | $3,206 | $38,730 | $24,800 | $13,930 |
| 2020 | $3,559 | $43,540 | $19,740 | $23,800 |
| 2019 | $3,526 | $43,540 | $19,740 | $23,800 |
| 2018 | $4,620 | $56,780 | $19,740 | $37,040 |
| 2017 | $4,766 | $56,780 | $19,740 | $37,040 |
| 2016 | $4,677 | $57,630 | $19,740 | $37,890 |
| 2015 | $4,849 | $57,630 | $19,740 | $37,890 |
| 2013 | $4,849 | $58,890 | $19,740 | $39,150 |
Source: Public Records
Map
Nearby Homes