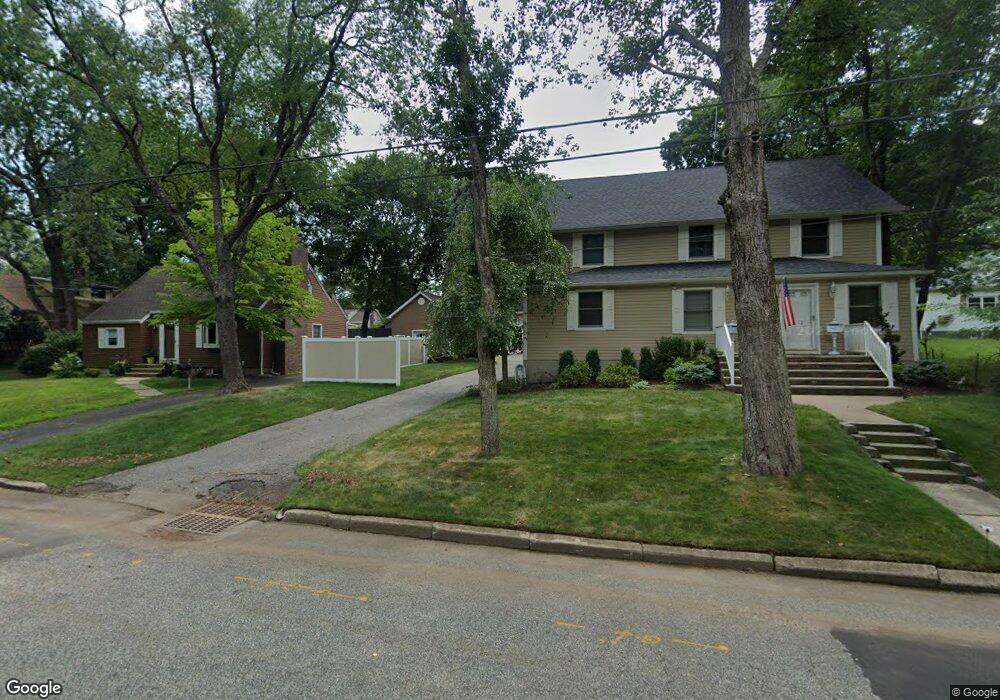
572 High St Unit 574 Closter, NJ 07624
Estimated Value: $1,073,000 - $1,706,000
--
Bed
--
Bath
3,790
Sq Ft
$352/Sq Ft
Est. Value
About This Home
This home is located at 572 High St Unit 574, Closter, NJ 07624 and is currently estimated at $1,332,390, approximately $351 per square foot. 572 High St Unit 574 is a home located in Bergen County with nearby schools including Hillside Elementary School, Tenakill Middle School, and Northern Valley Regional High School at Demarest.
Ownership History
Date
Name
Owned For
Owner Type
Purchase Details
Closed on
Sep 10, 1998
Sold by
Glaser Herbert S
Bought by
Maretic Alan and Berni Allison
Current Estimated Value
Home Financials for this Owner
Home Financials are based on the most recent Mortgage that was taken out on this home.
Original Mortgage
$232,800
Outstanding Balance
$49,816
Interest Rate
6.92%
Estimated Equity
$1,282,575
Purchase Details
Closed on
Jul 9, 1996
Sold by
Citibank N A
Bought by
Glaser Herbert
Create a Home Valuation Report for This Property
The Home Valuation Report is an in-depth analysis detailing your home's value as well as a comparison with similar homes in the area
Home Values in the Area
Average Home Value in this Area
Purchase History
| Date | Buyer | Sale Price | Title Company |
|---|---|---|---|
| Maretic Alan | $291,000 | -- | |
| Glaser Herbert | $256,125 | -- |
Source: Public Records
Mortgage History
| Date | Status | Borrower | Loan Amount |
|---|---|---|---|
| Open | Maretic Alan | $232,800 |
Source: Public Records
Tax History Compared to Growth
Tax History
| Year | Tax Paid | Tax Assessment Tax Assessment Total Assessment is a certain percentage of the fair market value that is determined by local assessors to be the total taxable value of land and additions on the property. | Land | Improvement |
|---|---|---|---|---|
| 2025 | $17,034 | $877,100 | $459,900 | $417,200 |
| 2024 | $16,361 | $805,000 | $402,400 | $402,600 |
| 2023 | $16,302 | $763,100 | $371,200 | $391,900 |
| 2022 | $16,302 | $737,000 | $363,700 | $373,300 |
| 2021 | $16,262 | $705,800 | $351,200 | $354,600 |
| 2020 | $15,956 | $712,000 | $354,700 | $357,300 |
| 2019 | $15,566 | $702,100 | $350,200 | $351,900 |
| 2018 | $15,388 | $691,300 | $346,200 | $345,100 |
| 2017 | $14,518 | $636,200 | $329,900 | $306,300 |
| 2016 | $14,245 | $636,200 | $329,900 | $306,300 |
| 2015 | $13,933 | $636,200 | $329,900 | $306,300 |
| 2014 | $13,545 | $636,200 | $329,900 | $306,300 |
Source: Public Records
Map
Nearby Homes
- 418 Closter Dock Rd
- 40 County Rd
- 504 High St
- 351 Closter Dock Rd
- 44 Pine Terrace
- 44 Orchard Rd
- 343 Demarest Ave
- 41 Orchard Rd
- 271 County Rd
- 20 Northwood Ave
- 22 Northwood Ave
- 258 County Rd
- 16 Donnybrook Dr
- 283 Harrington Ave
- 155 Closter Dock Rd
- 3 Central Ave
- 51 Julia St
- 728 Closter Dock Rd
- 232 County Rd
- 11 Blackledge Ct