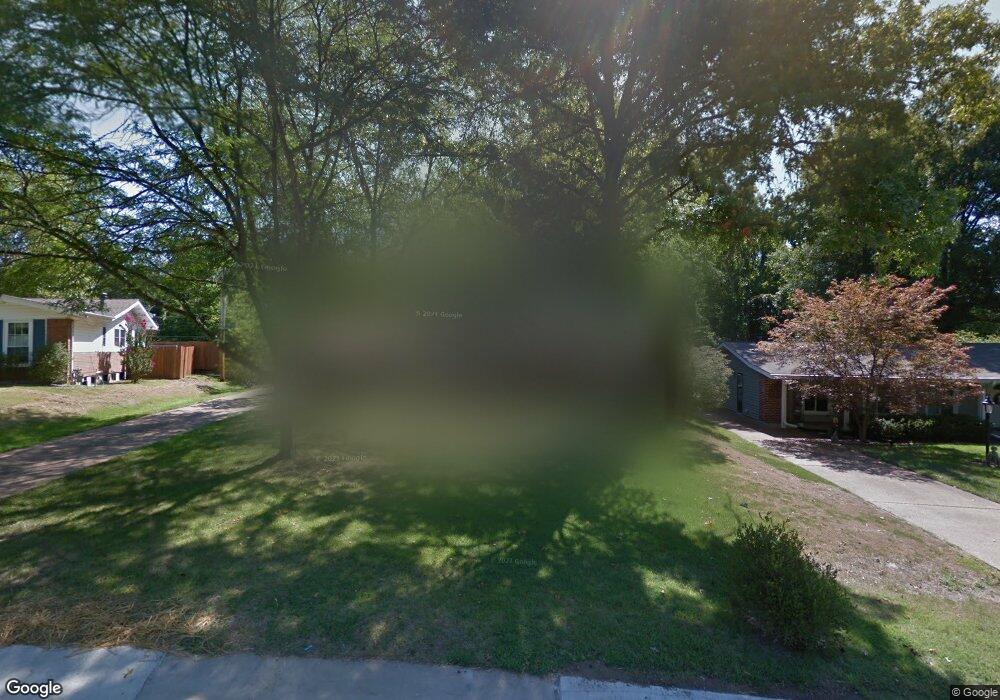
572 Highland Ridge Dr Ballwin, MO 63011
Estimated Value: $421,965 - $440,000
4
Beds
3
Baths
1,707
Sq Ft
$253/Sq Ft
Est. Value
About This Home
This home is located at 572 Highland Ridge Dr, Ballwin, MO 63011 and is currently estimated at $431,241, approximately $252 per square foot. 572 Highland Ridge Dr is a home located in St. Louis County with nearby schools including Henry Elementary School, Parkway West Middle School, and Parkway West High School.
Ownership History
Date
Name
Owned For
Owner Type
Purchase Details
Closed on
Nov 17, 2006
Sold by
Bower Rochelle S and Bower Shawn P
Bought by
Williams Robin L
Current Estimated Value
Home Financials for this Owner
Home Financials are based on the most recent Mortgage that was taken out on this home.
Original Mortgage
$225,000
Outstanding Balance
$153,670
Interest Rate
9.15%
Mortgage Type
Stand Alone First
Estimated Equity
$277,571
Purchase Details
Closed on
Dec 30, 2002
Sold by
Bower Rochelle S and Bower Shawn P
Bought by
Bower Shawn P and Bower Rochelle S
Home Financials for this Owner
Home Financials are based on the most recent Mortgage that was taken out on this home.
Original Mortgage
$140,000
Interest Rate
5.96%
Purchase Details
Closed on
Apr 29, 1998
Sold by
Johnstone Donald E and Johnstone Diane C
Bought by
Bower Shawn P and Presley Rochelle S
Home Financials for this Owner
Home Financials are based on the most recent Mortgage that was taken out on this home.
Original Mortgage
$143,550
Interest Rate
7.09%
Create a Home Valuation Report for This Property
The Home Valuation Report is an in-depth analysis detailing your home's value as well as a comparison with similar homes in the area
Home Values in the Area
Average Home Value in this Area
Purchase History
| Date | Buyer | Sale Price | Title Company |
|---|---|---|---|
| Williams Robin L | $225,000 | None Available | |
| Bower Shawn P | -- | -- | |
| Bower Shawn P | -- | -- |
Source: Public Records
Mortgage History
| Date | Status | Borrower | Loan Amount |
|---|---|---|---|
| Open | Williams Robin L | $225,000 | |
| Previous Owner | Bower Shawn P | $140,000 | |
| Previous Owner | Bower Shawn P | $143,550 |
Source: Public Records
Tax History Compared to Growth
Tax History
| Year | Tax Paid | Tax Assessment Tax Assessment Total Assessment is a certain percentage of the fair market value that is determined by local assessors to be the total taxable value of land and additions on the property. | Land | Improvement |
|---|---|---|---|---|
| 2025 | $4,613 | $73,110 | $28,880 | $44,230 |
| 2024 | $4,613 | $71,230 | $17,270 | $53,960 |
| 2023 | $4,548 | $71,230 | $17,270 | $53,960 |
| 2022 | $3,938 | $56,010 | $19,190 | $36,820 |
| 2021 | $3,915 | $56,010 | $19,190 | $36,820 |
| 2020 | $3,594 | $48,700 | $19,100 | $29,600 |
| 2019 | $3,553 | $48,700 | $19,100 | $29,600 |
| 2018 | $3,616 | $45,990 | $17,200 | $28,790 |
| 2017 | $3,513 | $45,990 | $17,200 | $28,790 |
| 2016 | $3,212 | $39,980 | $12,450 | $27,530 |
| 2015 | $3,363 | $39,980 | $12,450 | $27,530 |
| 2014 | $2,765 | $35,070 | $8,470 | $26,600 |
Source: Public Records
Map
Nearby Homes
- 103 Calico Ln
- 108 Old Oaks Dr
- 449 Wildwood Pkwy
- 496 Brightspur Ln
- 520 Kingridge Dr
- 15038 Claymoor Ct Unit 10
- 15038 Claymoor Ct Unit 3
- 2452 Claymoor Dr
- 713 Clayton Corners Dr
- 603 Rue Montand Dr
- 15009 Claymoor Ct Unit 15
- 15009 Claymoor Ct Unit 11
- 477 Ironwood Dr
- 15047 Green Circle Dr
- 14681 Amberleigh Hill Ct
- 695 Henry Ave
- 718 Savannah Crossing Way
- 2335 Manor Grove Dr Unit 9
- 2323 Manor Grove Dr Unit 4
- 2166 Bantry Ct Unit 26A
- 570 Highland Ridge Dr
- 574 Highland Ridge Dr
- 568 Highland Ridge Dr
- 576 Highland Ridge Dr
- 582 Highland Ridge Dr
- 571 Highland Ridge Dr
- 573 Highland Ridge Dr
- 569 Highland Ridge Dr
- 578 Highland Ridge Dr
- 100 Old Oaks Dr
- 4 Hideaway Ln
- 575 Highland Ridge Dr
- 3 Hideaway Ln
- 580 Highland Ridge Dr
- 102 Old Oaks Dr
- 577 Highland Ridge Dr
- 101 Calico Ln
- 567 Highland Ridge Dr
- 579 Highland Ridge Dr
- 106 Old Oaks Dr