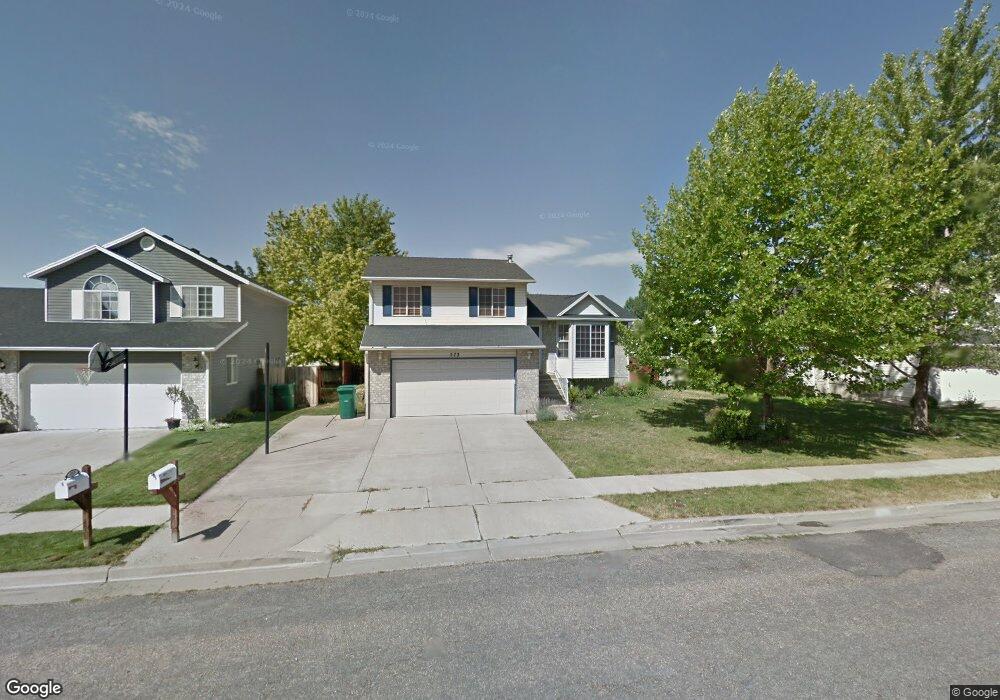
572 S 875 E Layton, UT 84041
Estimated Value: $488,127 - $527,000
4
Beds
2
Baths
2,074
Sq Ft
$244/Sq Ft
Est. Value
About This Home
This home is located at 572 S 875 E, Layton, UT 84041 and is currently estimated at $505,282, approximately $243 per square foot. 572 S 875 E is a home located in Davis County with nearby schools including Creekside Elementary School, Fairfield Junior High School, and Davis High School.
Ownership History
Date
Name
Owned For
Owner Type
Purchase Details
Closed on
Aug 3, 2021
Sold by
Thelen Ross
Bought by
Schmutz Nikki Anne
Current Estimated Value
Home Financials for this Owner
Home Financials are based on the most recent Mortgage that was taken out on this home.
Original Mortgage
$402,550
Outstanding Balance
$365,419
Interest Rate
2.93%
Mortgage Type
New Conventional
Estimated Equity
$139,863
Purchase Details
Closed on
Jun 19, 2007
Sold by
Astle Evan S and Astle Valerie K
Bought by
Thelen Ross
Home Financials for this Owner
Home Financials are based on the most recent Mortgage that was taken out on this home.
Original Mortgage
$201,832
Interest Rate
6.16%
Mortgage Type
Purchase Money Mortgage
Create a Home Valuation Report for This Property
The Home Valuation Report is an in-depth analysis detailing your home's value as well as a comparison with similar homes in the area
Home Values in the Area
Average Home Value in this Area
Purchase History
| Date | Buyer | Sale Price | Title Company |
|---|---|---|---|
| Schmutz Nikki Anne | -- | Title Guarantee Se | |
| Thelen Ross | -- | Founders Title Co Layton |
Source: Public Records
Mortgage History
| Date | Status | Borrower | Loan Amount |
|---|---|---|---|
| Open | Schmutz Nikki Anne | $402,550 | |
| Previous Owner | Thelen Ross | $201,832 |
Source: Public Records
Tax History
| Year | Tax Paid | Tax Assessment Tax Assessment Total Assessment is a certain percentage of the fair market value that is determined by local assessors to be the total taxable value of land and additions on the property. | Land | Improvement |
|---|---|---|---|---|
| 2025 | $2,180 | $228,800 | $89,910 | $138,890 |
| 2024 | $2,081 | $220,000 | $105,447 | $114,553 |
| 2023 | $2,076 | $387,000 | $131,892 | $255,108 |
| 2022 | $2,174 | $220,000 | $67,764 | $152,236 |
| 2021 | $2,027 | $306,000 | $90,054 | $215,946 |
| 2020 | $1,830 | $265,000 | $77,849 | $187,151 |
| 2019 | $1,784 | $253,000 | $75,880 | $177,120 |
| 2018 | $1,601 | $228,000 | $75,880 | $152,120 |
| 2016 | $1,476 | $108,405 | $22,884 | $85,521 |
| 2015 | $1,417 | $98,835 | $22,884 | $75,951 |
| 2014 | $1,469 | $104,724 | $22,884 | $81,840 |
| 2013 | -- | $95,061 | $19,034 | $76,027 |
Source: Public Records
Map
Nearby Homes
- 685 S Pheasant View Dr
- 679 S Clearwater Falls Dr
- 772 N Crimson Ln
- 680 N Main St Trlr E-11
- 706 S 600 E
- 766 N Stonne Ln
- 617 E 405 S
- 811 S Main St
- 623 E Clearwater Dr Unit 15
- 895 S Main St Unit E
- 1137 Holmes Creek Ln
- 905 S Main St Unit G
- 917 S Main St Unit H
- 680 N Main St Unit B13
- 524 Hyde Park Ln
- 389 Morgan St
- 9 Colonial Ave
- 86 Mill Rd
- 948 S 250 E
- 282 E 925 S
Your Personal Tour Guide
Ask me questions while you tour the home.