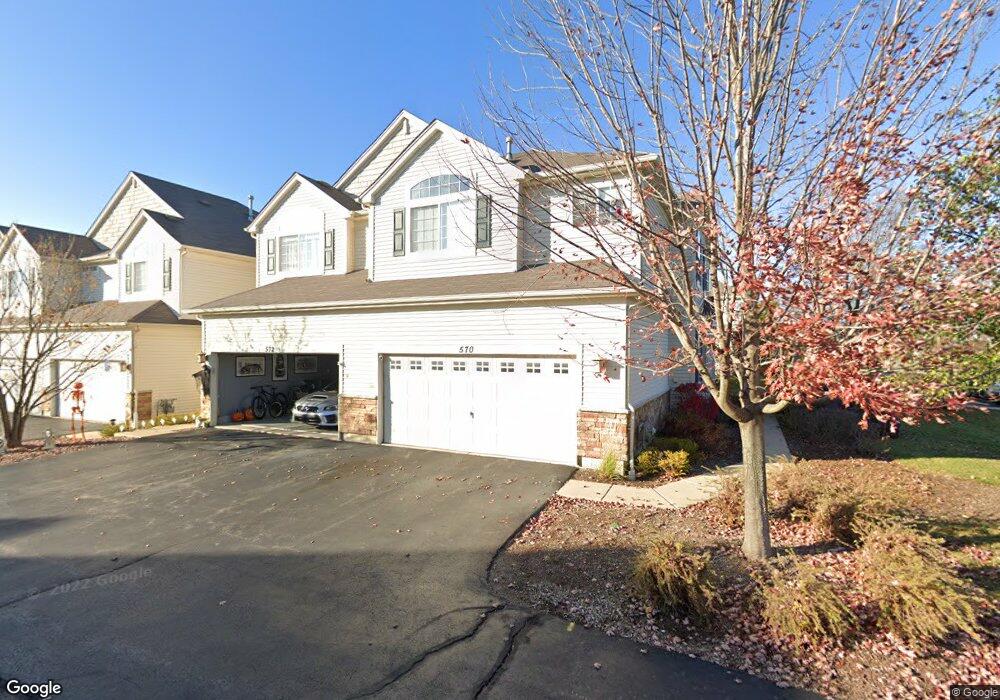
572 S Jade Ln Unit 3105 Round Lake, IL 60073
Estimated Value: $257,005 - $280,000
2
Beds
3
Baths
1,400
Sq Ft
$192/Sq Ft
Est. Value
About This Home
This home is located at 572 S Jade Ln Unit 3105, Round Lake, IL 60073 and is currently estimated at $269,001, approximately $192 per square foot. 572 S Jade Ln Unit 3105 is a home located in Lake County with nearby schools including Big Hollow Primary School, Big Hollow Elementary School, and Big Hollow Middle School.
Ownership History
Date
Name
Owned For
Owner Type
Purchase Details
Closed on
Feb 6, 2022
Sold by
Faudel Michael W
Bought by
Faudel Michael W and Ortigoza Coraima
Current Estimated Value
Purchase Details
Closed on
Nov 10, 2021
Sold by
Harves Matthew S
Bought by
Faudel Michael W
Home Financials for this Owner
Home Financials are based on the most recent Mortgage that was taken out on this home.
Original Mortgage
$200,700
Interest Rate
3.12%
Mortgage Type
New Conventional
Purchase Details
Closed on
Oct 13, 2016
Sold by
Finneraw Robyn
Bought by
Harris Matthew S
Purchase Details
Closed on
Apr 28, 2010
Sold by
The Ryland Group Inc
Bought by
Harves Matthew and Finneran Robyn
Home Financials for this Owner
Home Financials are based on the most recent Mortgage that was taken out on this home.
Original Mortgage
$159,847
Interest Rate
3.5%
Mortgage Type
FHA
Create a Home Valuation Report for This Property
The Home Valuation Report is an in-depth analysis detailing your home's value as well as a comparison with similar homes in the area
Home Values in the Area
Average Home Value in this Area
Purchase History
| Date | Buyer | Sale Price | Title Company |
|---|---|---|---|
| Faudel Michael W | -- | Patricia Gutierrez Pascual Esq | |
| Faudel Michael W | $223,000 | Old Republic National Title | |
| Harris Matthew S | -- | Attorney | |
| Harves Matthew | $162,000 | Ryland Title Company |
Source: Public Records
Mortgage History
| Date | Status | Borrower | Loan Amount |
|---|---|---|---|
| Previous Owner | Faudel Michael W | $200,700 | |
| Previous Owner | Harves Matthew | $159,847 |
Source: Public Records
Tax History Compared to Growth
Tax History
| Year | Tax Paid | Tax Assessment Tax Assessment Total Assessment is a certain percentage of the fair market value that is determined by local assessors to be the total taxable value of land and additions on the property. | Land | Improvement |
|---|---|---|---|---|
| 2024 | $5,127 | $77,085 | $9,039 | $68,046 |
| 2023 | $5,127 | $64,789 | $8,515 | $56,274 |
| 2022 | $5,127 | $56,305 | $5,082 | $51,223 |
| 2021 | $5,012 | $53,073 | $4,790 | $48,283 |
| 2020 | $5,077 | $52,315 | $4,722 | $47,593 |
| 2019 | $4,899 | $50,168 | $4,528 | $45,640 |
| 2018 | $4,473 | $46,608 | $7,612 | $38,996 |
| 2017 | $4,354 | $43,080 | $7,036 | $36,044 |
| 2016 | $5,090 | $45,307 | $6,435 | $38,872 |
| 2015 | $4,911 | $47,482 | $6,005 | $41,477 |
| 2014 | $5,048 | $42,869 | $5,734 | $37,135 |
| 2012 | $4,630 | $45,254 | $5,975 | $39,279 |
Source: Public Records
Map
Nearby Homes
- 398 S Jade Ln
- 23403 Illinois 120
- 31101 N Fairfield Rd
- 00 Gilmer Rd
- 0 Gilmer Rd Unit MRD12263293
- 26 N Berkshire Ln
- 338 S Litchfield Dr
- 308 S Fieldstone Ct
- 330 S Fieldstone Ct
- 389 Prairie Mist Dr
- 0 S Cedar Lake Rd Unit MRD12365608
- 33336 N Fish Lake Rd
- 26222 W Belvidere Rd
- 472 W Savoy Dr
- 1543 W Remington Ln
- 649 N Fox Trail
- 479 W Butterfield Ln
- 34156 N Redtop Rd
- 407 W Waterbury Dr
- 34113 N Primrose Ct
- 572 S Jade Ln Unit 31-5
- 570 S Jade Ln
- 570 S Jade Ln Unit 3106
- 576 S Jade Ln Unit 3103
- 578 S Jade Ln Unit 3102
- 580 S Jade Ln Unit 3101
- 552 S Jade Ln Unit 30-02
- 552 S Jade Ln
- 552 S Jade Ln Unit 552
- 554 S Jade Ln Unit 30-03
- 554 S Jade Ln
- 550 S Jade Ln
- 556 S Jade Ln Unit 30-04
- 556 S Jade Ln
- 592 S Jade Ln Unit 3202
- 592 S Jade Ln Unit 1
- 590 S Jade Ln Unit 3201
- 594 S Jade Ln Unit 3203
- 594 S Jade Ln Unit 594
- 558 S Jade Ln