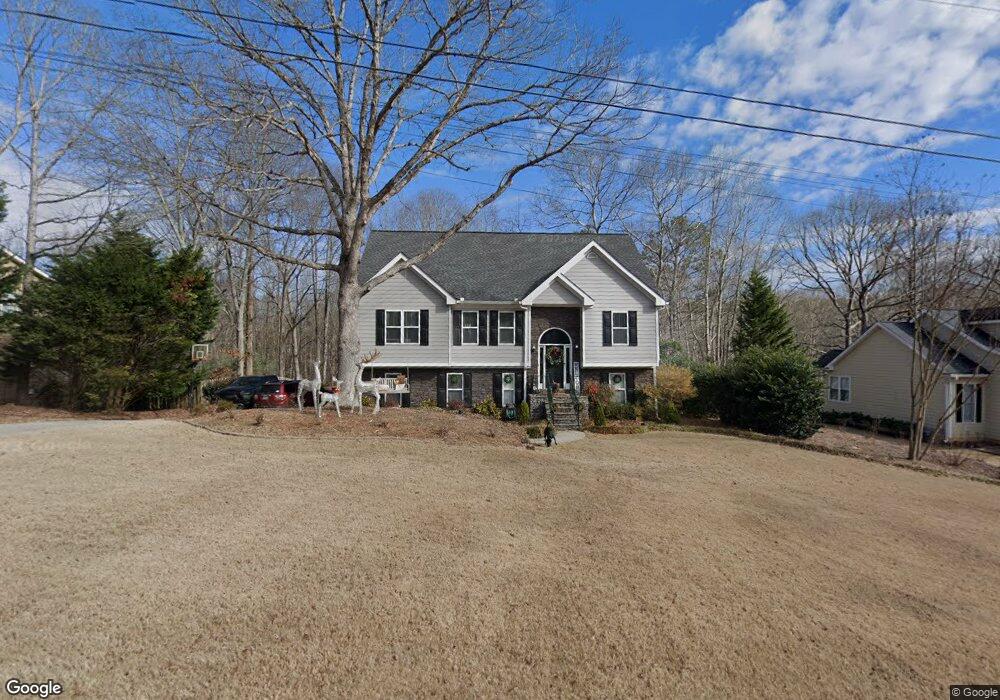
5720 Falls View Dr Unit 2 Buford, GA 30518
Estimated Value: $402,985 - $462,000
4
Beds
3
Baths
1,414
Sq Ft
$309/Sq Ft
Est. Value
About This Home
This home is located at 5720 Falls View Dr Unit 2, Buford, GA 30518 and is currently estimated at $436,996, approximately $309 per square foot. 5720 Falls View Dr Unit 2 is a home located in Hall County with nearby schools including Friendship Elementary School, C.W. Davis Middle School, and Flowery Branch High School.
Ownership History
Date
Name
Owned For
Owner Type
Purchase Details
Closed on
Jun 14, 2021
Sold by
Brand Brian A
Bought by
Jarosz Stephen A
Current Estimated Value
Home Financials for this Owner
Home Financials are based on the most recent Mortgage that was taken out on this home.
Original Mortgage
$313,310
Outstanding Balance
$282,425
Interest Rate
2.9%
Mortgage Type
New Conventional
Estimated Equity
$154,571
Purchase Details
Closed on
Mar 27, 2000
Sold by
Mclin Construction Inc
Bought by
Brand Brian A
Home Financials for this Owner
Home Financials are based on the most recent Mortgage that was taken out on this home.
Original Mortgage
$115,400
Interest Rate
7.38%
Mortgage Type
New Conventional
Purchase Details
Closed on
Nov 10, 1999
Sold by
Dac Enterprises Inc
Bought by
Mclin Construction Inc
Purchase Details
Closed on
Jan 15, 1997
Sold by
Dac Enterprises Inc
Bought by
Dac Enterprises Inc
Create a Home Valuation Report for This Property
The Home Valuation Report is an in-depth analysis detailing your home's value as well as a comparison with similar homes in the area
Home Values in the Area
Average Home Value in this Area
Purchase History
| Date | Buyer | Sale Price | Title Company |
|---|---|---|---|
| Jarosz Stephen A | $323,000 | -- | |
| Brand Brian A | $144,300 | -- | |
| Mclin Construction Inc | $29,500 | -- | |
| Dac Enterprises Inc | $443,900 | -- |
Source: Public Records
Mortgage History
| Date | Status | Borrower | Loan Amount |
|---|---|---|---|
| Open | Jarosz Stephen A | $313,310 | |
| Previous Owner | Brand Brian A | $115,400 |
Source: Public Records
Tax History Compared to Growth
Tax History
| Year | Tax Paid | Tax Assessment Tax Assessment Total Assessment is a certain percentage of the fair market value that is determined by local assessors to be the total taxable value of land and additions on the property. | Land | Improvement |
|---|---|---|---|---|
| 2025 | $3,442 | $156,000 | $11,560 | $144,440 |
| 2024 | $3,755 | $151,080 | $11,560 | $139,520 |
| 2023 | $3,158 | $142,760 | $11,560 | $131,200 |
| 2022 | $2,277 | $127,120 | $11,560 | $115,560 |
| 2021 | $2,267 | $85,600 | $11,560 | $74,040 |
| 2020 | $2,364 | $86,800 | $12,360 | $74,440 |
| 2019 | $2,432 | $88,520 | $12,360 | $76,160 |
| 2018 | $2,238 | $78,840 | $12,360 | $66,480 |
| 2017 | $2,035 | $72,360 | $12,360 | $60,000 |
| 2016 | $1,860 | $67,712 | $12,360 | $55,352 |
| 2015 | $1,875 | $67,712 | $12,360 | $55,352 |
| 2014 | $1,875 | $67,712 | $12,360 | $55,352 |
Source: Public Records
Map
Nearby Homes
- 2610 Buford Dam Rd
- 5832 Bay View Dr
- 6119 Bethany View Trail
- 5697 Frontier Walk Ln
- 6225 Bridgewood Dr
- 6205 Bridgewood Dr
- 2759 S Waterworks Rd
- 5926 Mount Water Trail
- 5862 Bay View Dr
- 0 Peachtree Industrial Blvd Unit 7679534
- 6228 Lanier Harbor Landing
- 5885 Bay View Dr
- 5775 Lakeshore Dr
- 2482 Windchase Ct
- 6386 Tuggle Dr
- 5989 Lanier Islands Pkwy
- 5450 N Richland Creek Rd
- 2999 S Waterworks Rd
- 5571 Shadburn Ferry Rd
- 3600 Shoreland Dr
- 5716 Falls View Dr
- 5724 Falls View Dr Unit 2
- 5728 Falls View Dr Unit 2
- 5712 Falls View Dr
- 5717 Falls View Dr Unit 2
- 5611 Ivy Green Dr Unit 2
- 5713 Falls View Dr Unit 2
- 5727 Falls View Dr
- 5708 Falls View Dr Unit 2
- 5606 Ivy Green Dr Unit 2
- 5709 Falls View Dr
- 5731 Falls View Dr Unit 2
- 4568 Falls View Dr
- 4559 Falls View Dr
- 4569 Falls View Dr
- 5736 Falls View Dr
- 5605 Ivy Green Dr
- 5735 Falls View Dr
- 5619 Lakeshore Rd Unit 1
- 5579 Lakeshore Rd