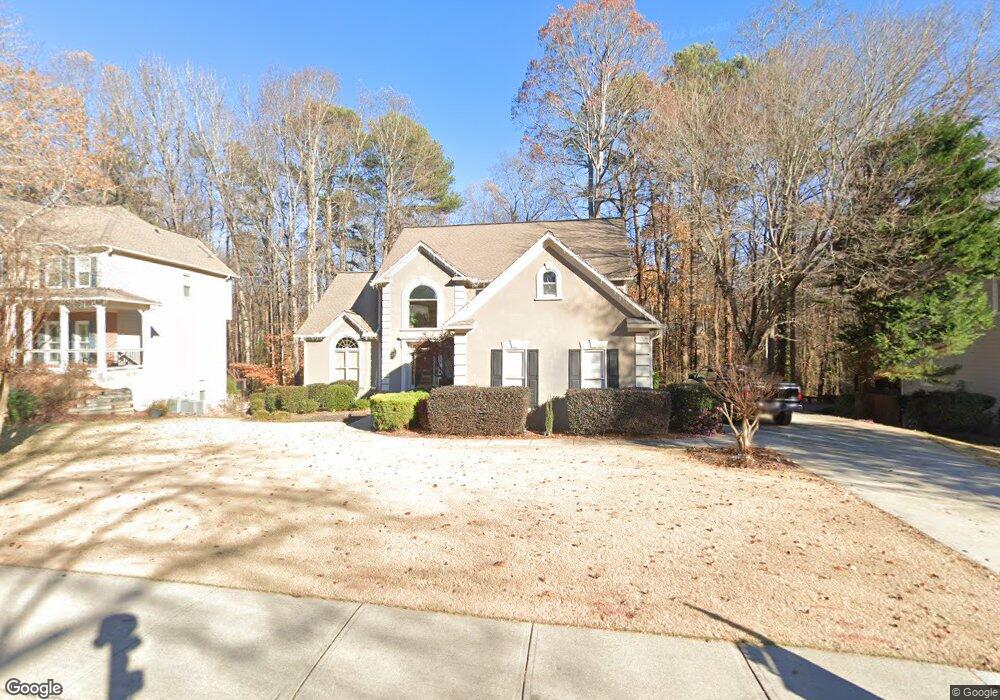
5720 N Hillbrooke Trace Unit 5 Alpharetta, GA 30005
Estimated Value: $659,000 - $741,382
4
Beds
4
Baths
2,702
Sq Ft
$257/Sq Ft
Est. Value
About This Home
This home is located at 5720 N Hillbrooke Trace Unit 5, Alpharetta, GA 30005 and is currently estimated at $693,596, approximately $256 per square foot. 5720 N Hillbrooke Trace Unit 5 is a home located in Fulton County with nearby schools including Abbotts Hill Elementary School, Taylor Road Middle School, and Chattahoochee High School.
Ownership History
Date
Name
Owned For
Owner Type
Purchase Details
Closed on
Aug 15, 2003
Sold by
Sabath Matthew
Bought by
Sabath Matthew and Sabath Amy
Current Estimated Value
Home Financials for this Owner
Home Financials are based on the most recent Mortgage that was taken out on this home.
Original Mortgage
$220,400
Outstanding Balance
$102,050
Interest Rate
6.33%
Mortgage Type
New Conventional
Estimated Equity
$591,546
Purchase Details
Closed on
Jun 7, 1996
Sold by
Donovan Thomas C Janet
Bought by
Davies Kent H Susan E
Purchase Details
Closed on
Mar 23, 1994
Sold by
Fowler Malcolm E Hortense
Bought by
Donovan Thomas C Janet D
Home Financials for this Owner
Home Financials are based on the most recent Mortgage that was taken out on this home.
Original Mortgage
$193,500
Interest Rate
7.26%
Create a Home Valuation Report for This Property
The Home Valuation Report is an in-depth analysis detailing your home's value as well as a comparison with similar homes in the area
Home Values in the Area
Average Home Value in this Area
Purchase History
| Date | Buyer | Sale Price | Title Company |
|---|---|---|---|
| Sabath Matthew | -- | -- | |
| Sabath Matthew | $244,900 | -- | |
| Davies Kent H Susan E | $218,000 | -- | |
| Donovan Thomas C Janet D | $215,000 | -- |
Source: Public Records
Mortgage History
| Date | Status | Borrower | Loan Amount |
|---|---|---|---|
| Open | Sabath Matthew | $220,400 | |
| Previous Owner | Donovan Thomas C Janet D | $193,500 | |
| Closed | Davies Kent H Susan E | $0 |
Source: Public Records
Tax History Compared to Growth
Tax History
| Year | Tax Paid | Tax Assessment Tax Assessment Total Assessment is a certain percentage of the fair market value that is determined by local assessors to be the total taxable value of land and additions on the property. | Land | Improvement |
|---|---|---|---|---|
| 2025 | $4,200 | $287,600 | $71,240 | $216,360 |
| 2023 | $6,874 | $243,520 | $55,400 | $188,120 |
| 2022 | $4,018 | $206,360 | $51,160 | $155,200 |
| 2021 | $3,961 | $159,800 | $44,640 | $115,160 |
| 2020 | $3,981 | $150,400 | $36,400 | $114,000 |
| 2019 | $495 | $147,720 | $35,720 | $112,000 |
| 2018 | $4,039 | $144,280 | $34,920 | $109,360 |
| 2017 | $3,930 | $132,600 | $37,040 | $95,560 |
| 2016 | $3,846 | $132,600 | $37,040 | $95,560 |
| 2015 | $3,887 | $132,600 | $37,040 | $95,560 |
| 2014 | $3,321 | $107,200 | $29,960 | $77,240 |
Source: Public Records
Map
Nearby Homes
- 775 Ellsborough Ct
- 5610 N Hillbrooke Trace
- 11615 Windbrooke Way
- 130 Wyndlam Ct
- 1660 Gladewood Dr
- 5575 Ashwind Trace
- 11420 Crossington Rd
- 11260 Donnington Dr
- 5785 Oxborough Way Unit 1
- 5325 Hillgate Crossing
- 335 Dunhill Way Ct
- 640 Arncliffe Ct Unit 1
- 230 Sessingham Ln
- 5680 Abbotts Bridge Rd
- 5690 Abbotts Bridge Rd
- 11235 Surrey Park Trail
- 5730 N Hillbrooke Trace Unit 5
- 5710 N Hillbrooke Trace Unit 5
- 5740 N Hillbrooke Trace Unit 5
- 5700 N Hillbrooke Trace
- 5685 N Hillbrooke Trace
- 5695 N Hillbrooke Trace Unit 5
- 5550 Oxborough Way Unit 3
- 5675 N Hillbrooke Trace
- 315 Huntwick Ct
- 5705 N Hillbrooke Trace
- 5750 N Hillbrooke Trace
- 5530 Oxborough Way Unit 3
- 325 Huntwick Ct
- 5665 N Hillbrooke Trace
- 5715 N Hillbrooke Trace Unit 5
- 5760 N Hillbrooke Trace Unit 5
- 220 Bristolstone Ct
- 5560 Oxborough Way
- 320 Huntwick Ct
- 210 Bristolstone Ct Unit 5