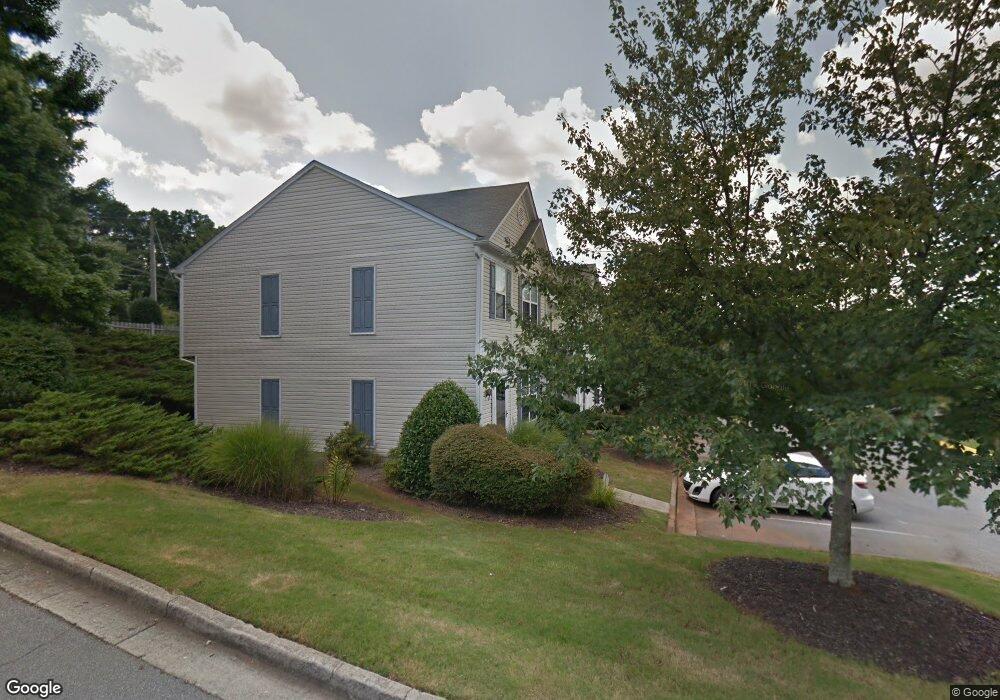
5720 Reps Trace Norcross, GA 30071
Estimated Value: $303,000 - $335,000
3
Beds
3
Baths
1,452
Sq Ft
$220/Sq Ft
Est. Value
About This Home
This home is located at 5720 Reps Trace, Norcross, GA 30071 and is currently estimated at $320,108, approximately $220 per square foot. 5720 Reps Trace is a home located in Gwinnett County with nearby schools including Norcross Elementary School, Summerour Middle School, and Paul Duke STEM High School.
Ownership History
Date
Name
Owned For
Owner Type
Purchase Details
Closed on
Feb 21, 2013
Sold by
Dennis Lisa A
Bought by
Yohannes Meletetsega
Current Estimated Value
Home Financials for this Owner
Home Financials are based on the most recent Mortgage that was taken out on this home.
Original Mortgage
$69,600
Outstanding Balance
$48,529
Interest Rate
3.43%
Estimated Equity
$271,579
Purchase Details
Closed on
Dec 14, 2001
Sold by
Luoto Piritta K
Bought by
Dennis Lisa
Home Financials for this Owner
Home Financials are based on the most recent Mortgage that was taken out on this home.
Original Mortgage
$131,100
Interest Rate
6.49%
Purchase Details
Closed on
Nov 16, 1998
Sold by
Goochey Cameo L
Bought by
Luoto Piritta K
Home Financials for this Owner
Home Financials are based on the most recent Mortgage that was taken out on this home.
Original Mortgage
$104,400
Interest Rate
6.77%
Purchase Details
Closed on
Sep 30, 1997
Sold by
Canterbury Communities Inc
Bought by
Goochey Cameo L
Create a Home Valuation Report for This Property
The Home Valuation Report is an in-depth analysis detailing your home's value as well as a comparison with similar homes in the area
Home Values in the Area
Average Home Value in this Area
Purchase History
| Date | Buyer | Sale Price | Title Company |
|---|---|---|---|
| Yohannes Meletetsega | $87,000 | -- | |
| Dennis Lisa | $138,000 | -- | |
| Luoto Piritta K | $109,900 | -- | |
| Goochey Cameo L | $99,900 | -- |
Source: Public Records
Mortgage History
| Date | Status | Borrower | Loan Amount |
|---|---|---|---|
| Open | Yohannes Meletetsega | $69,600 | |
| Previous Owner | Dennis Lisa | $131,100 | |
| Previous Owner | Luoto Piritta K | $104,400 | |
| Closed | Goochey Cameo L | -- |
Source: Public Records
Tax History Compared to Growth
Tax History
| Year | Tax Paid | Tax Assessment Tax Assessment Total Assessment is a certain percentage of the fair market value that is determined by local assessors to be the total taxable value of land and additions on the property. | Land | Improvement |
|---|---|---|---|---|
| 2025 | $2,550 | $119,160 | $28,080 | $91,080 |
| 2024 | $2,721 | $121,600 | $18,400 | $103,200 |
| 2023 | $2,721 | $110,520 | $18,400 | $92,120 |
| 2022 | $2,250 | $98,240 | $18,400 | $79,840 |
| 2021 | $1,560 | $62,800 | $11,600 | $51,200 |
| 2020 | $1,576 | $62,800 | $11,600 | $51,200 |
| 2019 | $2,169 | $65,240 | $11,600 | $53,640 |
| 2018 | $1,503 | $59,160 | $9,600 | $49,560 |
| 2016 | $1,407 | $54,520 | $9,600 | $44,920 |
| 2015 | $1,694 | $48,120 | $9,600 | $38,520 |
| 2014 | -- | $34,800 | $9,600 | $25,200 |
Source: Public Records
Map
Nearby Homes
- 5587 Trace Views Dr Unit 8
- 5589 Trace Views Dr
- 505 Cochran Dr
- 265 Dogwood Walk Ln Unit 7
- 3153 Corner Oak Dr
- 2928 Stanstead Cir
- 3118 Stanstead Ct
- 746 Oak Terrace
- 5400 Fontenoy Ct Unit 2
- 5534 Wynhall Dr
- 2824 Langford Commons Dr
- 53AND63 Born St
- 53 Born St
- 5747 Pine Oak Dr
- 435 Webb Dr
- 757 Sunset Dr
- 186 Wingo St
- 5720 Reps Trace Unit 5720
- 5720 Reps Trace Unit I
- 5724 Reps Trace
- 5724 Reps Trace
- 5724 Reps Trace Unit 5724
- 5714 Reps Trace
- 5730 Reps Trace
- 5710 Reps Trace
- 5734 Reps Trace Unit 5734
- 5740 Reps Trace
- 5744 Reps Trace
- 1867 Reps Trace
- 0 Reps Trace Unit 7504650
- 0 Reps Trace Unit 7253373
- 0 Reps Trace Unit 7015562
- 0 Reps Trace Unit 7092921
- 0 Reps Trace Unit 3136245
- 0 Reps Trace Unit 8532937
- 0 Reps Trace Unit 7101148
- 0 Reps Trace Unit 8145811