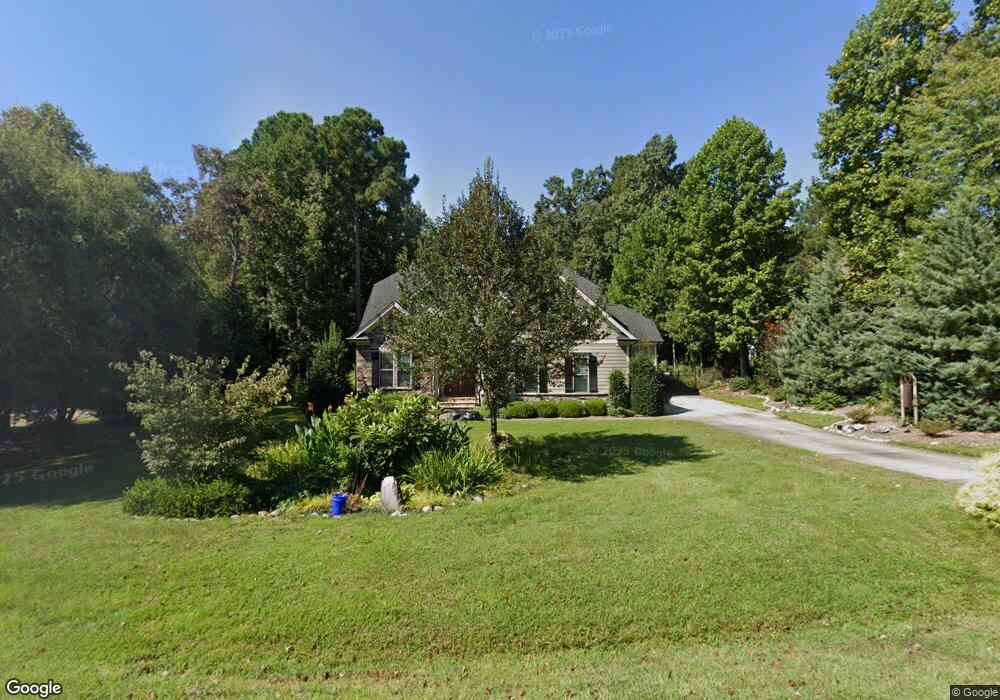
5721 Barham Crossing Dr Unit 16 Wake Forest, NC 27587
Estimated Value: $656,410 - $808,000
--
Bed
--
Bath
2,839
Sq Ft
$258/Sq Ft
Est. Value
About This Home
This home is located at 5721 Barham Crossing Dr Unit 16, Wake Forest, NC 27587 and is currently estimated at $732,603, approximately $258 per square foot. 5721 Barham Crossing Dr Unit 16 is a home located in Wake County with nearby schools including Wakelon Elementary School, Zebulon Magnet Middle School, and Rolesville High School.
Ownership History
Date
Name
Owned For
Owner Type
Purchase Details
Closed on
Jul 10, 2025
Sold by
Obregon Edmund and Obregon Marcia A
Bought by
Obregon Edmund and Obregon Marcia A
Current Estimated Value
Purchase Details
Closed on
Apr 29, 2014
Sold by
A R Nix Construction Inc
Bought by
Obegon Edmund and Obegon Marcia
Home Financials for this Owner
Home Financials are based on the most recent Mortgage that was taken out on this home.
Original Mortgage
$198,000
Interest Rate
4.44%
Mortgage Type
New Conventional
Purchase Details
Closed on
Jul 29, 2013
Sold by
Greenleaf Properties Llc
Bought by
A R Nix Construction Inc
Home Financials for this Owner
Home Financials are based on the most recent Mortgage that was taken out on this home.
Original Mortgage
$36,227
Interest Rate
4%
Mortgage Type
Construction
Create a Home Valuation Report for This Property
The Home Valuation Report is an in-depth analysis detailing your home's value as well as a comparison with similar homes in the area
Home Values in the Area
Average Home Value in this Area
Purchase History
| Date | Buyer | Sale Price | Title Company |
|---|---|---|---|
| Obregon Edmund | -- | None Listed On Document | |
| Obregon Edmund | -- | None Listed On Document | |
| Obegon Edmund | $370,000 | None Available | |
| A R Nix Construction Inc | $45,000 | None Available |
Source: Public Records
Mortgage History
| Date | Status | Borrower | Loan Amount |
|---|---|---|---|
| Previous Owner | Obegon Edmund | $198,000 | |
| Previous Owner | A R Nix Construction Inc | $36,227 |
Source: Public Records
Tax History Compared to Growth
Tax History
| Year | Tax Paid | Tax Assessment Tax Assessment Total Assessment is a certain percentage of the fair market value that is determined by local assessors to be the total taxable value of land and additions on the property. | Land | Improvement |
|---|---|---|---|---|
| 2025 | $3,717 | $578,054 | $165,000 | $413,054 |
| 2024 | $3,610 | $578,054 | $165,000 | $413,054 |
| 2023 | $3,159 | $402,564 | $71,500 | $331,064 |
| 2022 | $2,927 | $402,564 | $71,500 | $331,064 |
| 2021 | $2,849 | $402,564 | $71,500 | $331,064 |
| 2020 | $2,802 | $402,564 | $71,500 | $331,064 |
| 2019 | $3,176 | $386,420 | $54,000 | $332,420 |
| 2018 | $2,920 | $386,420 | $54,000 | $332,420 |
| 2017 | $2,767 | $386,420 | $54,000 | $332,420 |
| 2016 | $2,711 | $386,420 | $54,000 | $332,420 |
| 2015 | $2,776 | $396,871 | $80,000 | $316,871 |
| 2014 | $2,631 | $80,000 | $80,000 | $0 |
Source: Public Records
Map
Nearby Homes
- 7001 Barham Hollow Dr
- 6733 Oscar Barham Rd
- 6509 Zebulon Rd
- 11633 Louisburg Rd
- 0 S Us 401 Hwy
- 5728 Stuarts Ridge Rd
- 6404 Pulley Town Rd
- 65 Linnett Ct
- 150 Williamston Ridge Dr
- 4822 N Carolina 98
- 20 Willows Den Ct
- 90 Eagle Chase Dr
- 6104 Hope Farm Ln Unit 2
- 6104 Hope Farm Ln
- 6428 Prescott Chase Dr
- 20 Richmond Place
- 20 Little River Ct
- 5021 Mitchell Town Rd
- 195 Owl Dr
- 1740 Moores Pond Rd
- 5721 Barham Crossing Dr
- 5725 Barham Crossing Dr
- 5717 Barham Crossing Dr
- 5701 Barham Crossing Dr
- 0 Barham Crossing Dr Unit 1645445
- 0 Barham Crossing Dr Unit 1645448
- 0 Barham Crossing Dr Unit 1645434
- 0 Barham Crossing Dr Unit 1645430
- 0 Barham Crossing Dr Unit 1645422
- 0 Barham Crossing Dr Unit 16 TR1645422
- 0 Barham Crossing Dr Unit 23 1645445
- 0 Barham Crossing Dr Unit 22 1645434
- 0 Barham Crossing Dr Unit 24 1645448
- 0 Barham Crossing Dr Unit 21 1645430
- 5701 Barham Crossing Dr Unit 12
- 5713 Barham Crossing Dr
- 5713 Barham Crossing Dr Unit 14
- 5729 Barham Crossing Dr
- 6801 Barham Hollow Dr
- 6801 Barham Hollow Dr Unit 9