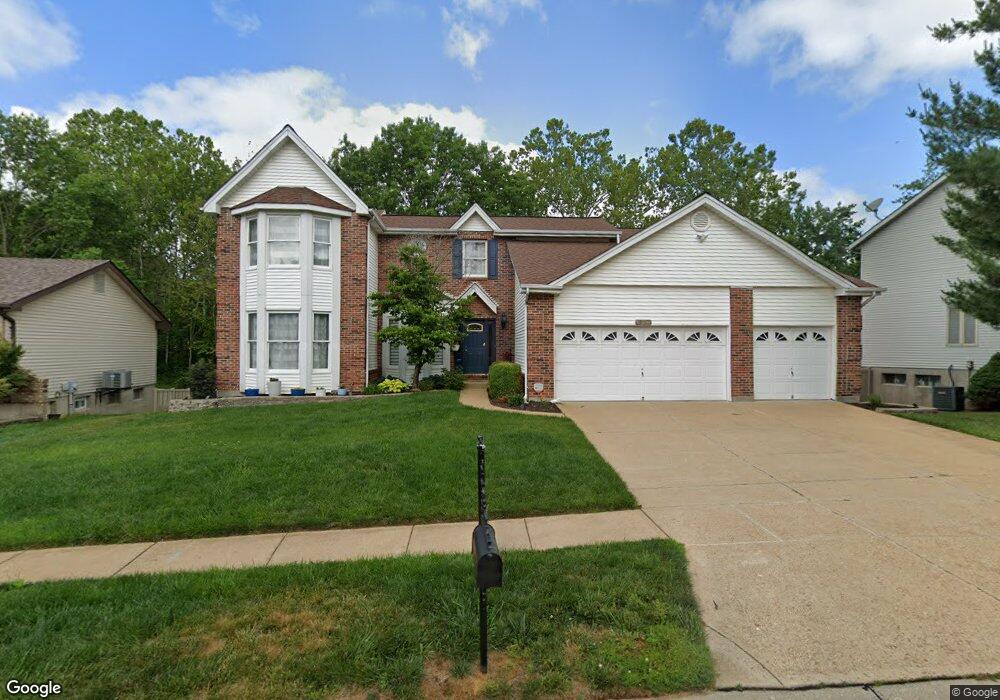
5721 Shining Day Place Saint Louis, MO 63128
Estimated Value: $418,000 - $471,000
5
Beds
4
Baths
2,193
Sq Ft
$203/Sq Ft
Est. Value
About This Home
This home is located at 5721 Shining Day Place, Saint Louis, MO 63128 and is currently estimated at $444,108, approximately $202 per square foot. 5721 Shining Day Place is a home located in St. Louis County with nearby schools including Hagemann Elementary School, Washington Middle School, and Mehlville High School.
Ownership History
Date
Name
Owned For
Owner Type
Purchase Details
Closed on
Sep 27, 2011
Sold by
Nicoletti Cory and Nicoletti Erin
Bought by
Nicoletti Cory and Nicoletti Erin
Current Estimated Value
Home Financials for this Owner
Home Financials are based on the most recent Mortgage that was taken out on this home.
Original Mortgage
$223,000
Outstanding Balance
$152,855
Interest Rate
4.28%
Mortgage Type
New Conventional
Estimated Equity
$291,253
Purchase Details
Closed on
Mar 20, 2009
Sold by
Hsbc Mortgage Services Inc
Bought by
Nicoletti Corey and Nicoletti Erin
Home Financials for this Owner
Home Financials are based on the most recent Mortgage that was taken out on this home.
Original Mortgage
$227,905
Interest Rate
5.24%
Mortgage Type
Purchase Money Mortgage
Purchase Details
Closed on
Jan 16, 2009
Sold by
Baker Carol A
Bought by
Hsbc Mortgage Services Inc
Purchase Details
Closed on
Dec 11, 2001
Sold by
Baker Robert L and Baker Carol A
Bought by
Baker Carol A
Purchase Details
Closed on
Apr 10, 2001
Sold by
Baker Carol A
Bought by
Baker Carol A
Purchase Details
Closed on
Jul 22, 2000
Sold by
Baker Robert L
Bought by
Baker Carol A
Purchase Details
Closed on
Jun 30, 1997
Sold by
Baker Robert L and Baker Carol A
Bought by
Baker Robert L and Baker Carol A
Create a Home Valuation Report for This Property
The Home Valuation Report is an in-depth analysis detailing your home's value as well as a comparison with similar homes in the area
Home Values in the Area
Average Home Value in this Area
Purchase History
| Date | Buyer | Sale Price | Title Company |
|---|---|---|---|
| Nicoletti Cory | -- | At | |
| Nicoletti Corey | -- | Us Title North | |
| Hsbc Mortgage Services Inc | $239,108 | None Available | |
| Baker Carol A | -- | -- | |
| Baker Carol A | -- | -- | |
| Baker Carol A | -- | -- | |
| Baker Robert L | -- | -- |
Source: Public Records
Mortgage History
| Date | Status | Borrower | Loan Amount |
|---|---|---|---|
| Open | Nicoletti Cory | $223,000 | |
| Closed | Nicoletti Corey | $227,905 |
Source: Public Records
Tax History Compared to Growth
Tax History
| Year | Tax Paid | Tax Assessment Tax Assessment Total Assessment is a certain percentage of the fair market value that is determined by local assessors to be the total taxable value of land and additions on the property. | Land | Improvement |
|---|---|---|---|---|
| 2025 | $4,808 | $78,660 | $25,590 | $53,070 |
| 2024 | $4,808 | $71,690 | $12,810 | $58,880 |
| 2023 | $4,808 | $71,690 | $12,810 | $58,880 |
| 2022 | $3,837 | $58,180 | $11,190 | $46,990 |
| 2021 | $3,713 | $58,180 | $11,190 | $46,990 |
| 2020 | $3,755 | $55,980 | $9,600 | $46,380 |
| 2019 | $3,744 | $55,980 | $9,600 | $46,380 |
| 2018 | $3,469 | $46,800 | $8,020 | $38,780 |
| 2017 | $3,464 | $46,800 | $8,020 | $38,780 |
| 2016 | $3,756 | $48,720 | $8,020 | $40,700 |
| 2015 | $3,447 | $48,720 | $8,020 | $40,700 |
| 2014 | $3,213 | $44,920 | $7,700 | $37,220 |
Source: Public Records
Map
Nearby Homes
- 5714 Shining Day Place
- 5812 Chrisbrook Dr
- 5718 Wieland Dr
- 6006 Grand Marnier Dr
- 4523 Beaver Brook Ct
- 6055 Bayou Bend Ct
- 5942 Hawkins Fuchs Rd
- 5626 Greenton Way
- 4251 Green Grove Ct
- 4716 Medalton Way
- 5417 Morningdale Place
- 4968 Quail Crest Ct
- 4357 Bristol View Ct
- 4374 Bristol View Ct
- 5028 Baldcypress Ct
- 4209 Consett Dr
- 5600 Wickershire Ln
- 5952 Shortleaf Ct
- 6401 Brookfield Court Dr
- 6401 Brookfield Court Dr Unit 102
- 5727 Shining Day Place
- 5715 Shining Day Place
- 5720 Shining Day Place
- 5726 Shining Day Place
- 5742 Grey Dove Place
- 5748 Grey Dove Place
- 5754 Grey Dove Place
- 5760 Grey Dove Place
- 5708 Shining Day Place
- 4404 Grey Haven
- 5736 Grey Dove Place
- 4459 Lilacridge Ln
- 5702 Shining Day Place
- 4455 Lilacridge Ln
- 5801 Morning Field Place
- 4400 Grey Haven
- 5735 Grey Dove Place
- 5805 Morning Field Place
- 4503 Greyfield
- 5759 Grey Dove Place