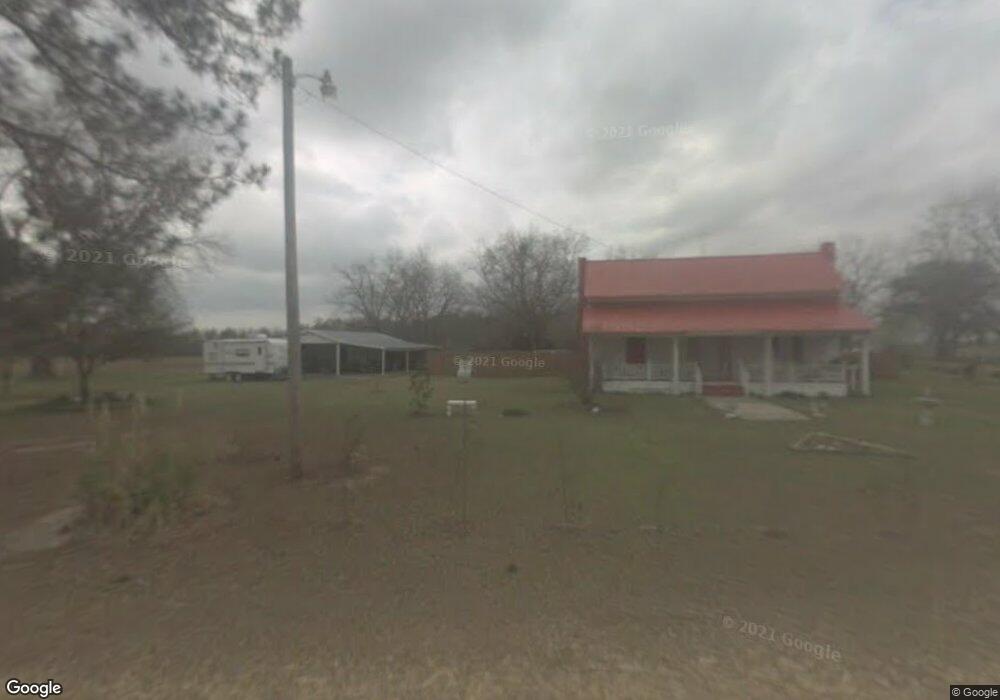
5722 Grapevine Rd Garfield, GA 30425
Estimated Value: $70,000 - $331,000
3
Beds
1
Bath
1,760
Sq Ft
$82/Sq Ft
Est. Value
About This Home
This home is located at 5722 Grapevine Rd, Garfield, GA 30425 and is currently estimated at $143,758, approximately $81 per square foot. 5722 Grapevine Rd is a home located in Jenkins County with nearby schools including Jenkins County Elementary School, Jenkins County Middle School, and Jenkins County High School.
Ownership History
Date
Name
Owned For
Owner Type
Purchase Details
Closed on
Jun 8, 2022
Sold by
Wommack Keith D
Bought by
Clemens Tiffany E and Waldbart Joshua
Current Estimated Value
Home Financials for this Owner
Home Financials are based on the most recent Mortgage that was taken out on this home.
Original Mortgage
$60,000
Outstanding Balance
$54,014
Interest Rate
5.3%
Mortgage Type
New Conventional
Estimated Equity
$89,744
Purchase Details
Closed on
Jun 2, 2010
Sold by
Sea Island Bank
Bought by
Wommack Keith D
Purchase Details
Closed on
Mar 31, 2008
Sold by
Herring William T
Bought by
Blackburn Randy G
Purchase Details
Closed on
Jul 10, 2007
Sold by
Newman William R
Bought by
Newman William R and Newman Doris Faye
Create a Home Valuation Report for This Property
The Home Valuation Report is an in-depth analysis detailing your home's value as well as a comparison with similar homes in the area
Purchase History
| Date | Buyer | Sale Price | Title Company |
|---|---|---|---|
| Clemens Tiffany E | $60,000 | -- | |
| Wommack Keith D | $30,000 | -- | |
| Blackburn Randy G | -- | -- | |
| Newman William R | -- | -- | |
| Newman William R | -- | -- |
Source: Public Records
Mortgage History
| Date | Status | Borrower | Loan Amount |
|---|---|---|---|
| Open | Clemens Tiffany E | $60,000 |
Source: Public Records
Tax History
| Year | Tax Paid | Tax Assessment Tax Assessment Total Assessment is a certain percentage of the fair market value that is determined by local assessors to be the total taxable value of land and additions on the property. | Land | Improvement |
|---|---|---|---|---|
| 2024 | $769 | $33,560 | $4,800 | $28,760 |
| 2023 | $603 | $29,440 | $4,800 | $24,640 |
| 2022 | $553 | $19,880 | $4,800 | $15,080 |
| 2021 | $563 | $19,880 | $4,800 | $15,080 |
| 2020 | $583 | $19,880 | $4,800 | $15,080 |
| 2019 | $540 | $16,491 | $4,858 | $11,633 |
| 2018 | $431 | $16,491 | $4,858 | $11,633 |
| 2017 | $507 | $16,491 | $4,858 | $11,633 |
| 2016 | $506 | $16,491 | $4,858 | $11,633 |
| 2015 | -- | $16,490 | $4,858 | $11,633 |
| 2014 | -- | $16,490 | $4,858 | $11,633 |
Source: Public Records
Map
Nearby Homes
- 0 Bowen Hill Rd
- 405 Monroe St
- 211 S Railroad St
- 1951 Tru Fail Crossing Rd
- 2001 Tru Fail Crossing Rd
- 174 Pike Johnson Rd
- 2001 Tru Fail Crossing Rd
- 0 Crooked Rd Unit 10686870
- 0 Crooked Rd Unit 26263845
- 0 Old Moore Rd
- 2039 Buttermilk Rd
- 5418 Carlton Rd
- 424 L B Hall Rd
- 5555 Carlton Ln
- 418 Oglesby Pond Ln
- 0 Mount Zion Church Rd
- 4539 Lewis Church Rd
- 5502 Moore Rd
- 296 Pleasant Hill Rd
- 1212 Lake Collins Rd
Your Personal Tour Guide
Ask me questions while you tour the home.