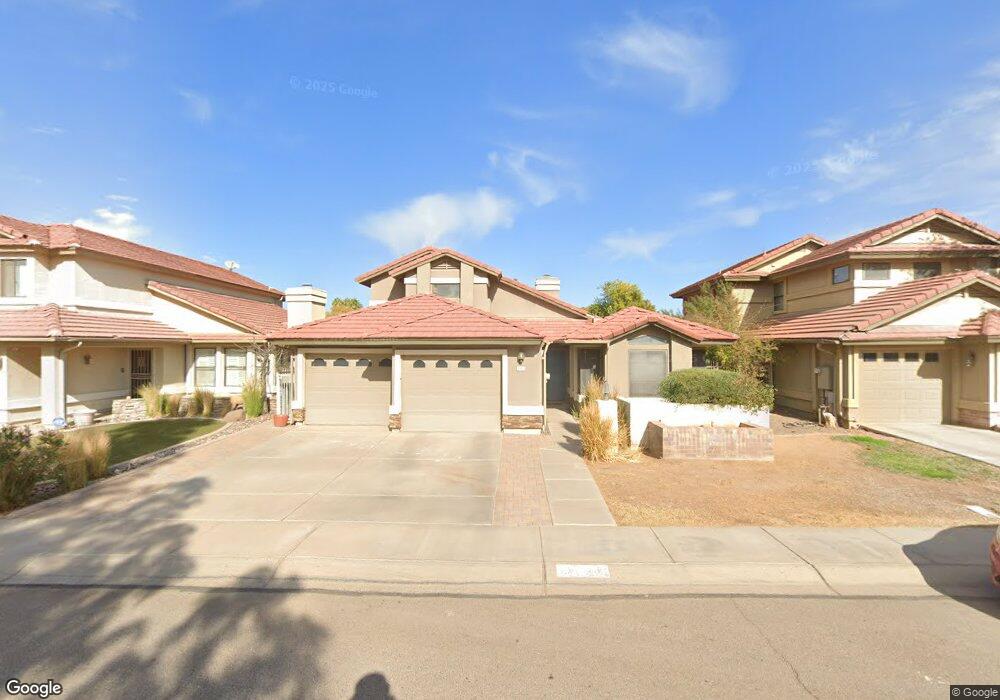
5722 W Ivanhoe St Chandler, AZ 85226
West Chandler NeighborhoodEstimated Value: $560,565 - $636,000
--
Bed
4
Baths
2,295
Sq Ft
$262/Sq Ft
Est. Value
About This Home
This home is located at 5722 W Ivanhoe St, Chandler, AZ 85226 and is currently estimated at $602,391, approximately $262 per square foot. 5722 W Ivanhoe St is a home located in Maricopa County with nearby schools including Kyrene de la Mirada Elementary School, Kyrene del Pueblo Middle School, and Corona Del Sol High School.
Ownership History
Date
Name
Owned For
Owner Type
Purchase Details
Closed on
Jun 19, 2008
Sold by
Lumpkin Monica Annette
Bought by
Lumpkin Monica and Lumpkin Family Trust
Current Estimated Value
Purchase Details
Closed on
Jan 30, 2002
Sold by
Warner Larry Robert and Armendarez Theresa Marie
Bought by
Lumpkin Monica Annette
Home Financials for this Owner
Home Financials are based on the most recent Mortgage that was taken out on this home.
Original Mortgage
$173,600
Outstanding Balance
$72,339
Interest Rate
7.17%
Mortgage Type
New Conventional
Estimated Equity
$530,052
Purchase Details
Closed on
Feb 24, 1999
Sold by
Schneider Linda J
Bought by
Warner Larry Robert and Armendarez Theresa Marie
Home Financials for this Owner
Home Financials are based on the most recent Mortgage that was taken out on this home.
Original Mortgage
$160,000
Interest Rate
6.78%
Create a Home Valuation Report for This Property
The Home Valuation Report is an in-depth analysis detailing your home's value as well as a comparison with similar homes in the area
Home Values in the Area
Average Home Value in this Area
Purchase History
| Date | Buyer | Sale Price | Title Company |
|---|---|---|---|
| Lumpkin Monica | -- | None Available | |
| Lumpkin Monica Annette | $217,000 | First American Title Ins Co | |
| Warner Larry Robert | $168,500 | Stewart Title & Trust |
Source: Public Records
Mortgage History
| Date | Status | Borrower | Loan Amount |
|---|---|---|---|
| Open | Lumpkin Monica Annette | $173,600 | |
| Previous Owner | Warner Larry Robert | $160,000 | |
| Closed | Lumpkin Monica Annette | $21,700 |
Source: Public Records
Tax History Compared to Growth
Tax History
| Year | Tax Paid | Tax Assessment Tax Assessment Total Assessment is a certain percentage of the fair market value that is determined by local assessors to be the total taxable value of land and additions on the property. | Land | Improvement |
|---|---|---|---|---|
| 2025 | $2,626 | $32,962 | -- | -- |
| 2024 | $2,511 | $31,392 | -- | -- |
| 2023 | $2,511 | $45,820 | $9,160 | $36,660 |
| 2022 | $2,390 | $34,070 | $6,810 | $27,260 |
| 2021 | $2,521 | $32,710 | $6,540 | $26,170 |
| 2020 | $2,463 | $31,250 | $6,250 | $25,000 |
| 2019 | $2,391 | $30,730 | $6,140 | $24,590 |
| 2018 | $2,312 | $28,220 | $5,640 | $22,580 |
| 2017 | $2,204 | $27,700 | $5,540 | $22,160 |
| 2016 | $2,249 | $26,920 | $5,380 | $21,540 |
| 2015 | $2,076 | $26,080 | $5,210 | $20,870 |
Source: Public Records
Map
Nearby Homes
- 5726 W Ivanhoe St
- 5751 W Del Rio St
- 881 N Pineview Dr
- 5665 W Galveston St Unit 76
- 5959 W Del Rio St
- 500 N Gila Springs Blvd Unit 230
- 500 N Gila Springs Blvd Unit 113
- 5291 W Del Rio St
- 5170 W Ivanhoe St
- 300 N Gila Springs Blvd Unit 181
- 500 N Roosevelt Ave Unit 2
- 500 N Roosevelt Ave Unit 87
- 500 N Roosevelt Ave Unit 40
- 500 N Roosevelt Ave Unit 26
- 6302 W Megan St
- 5455 W Buffalo St
- 4772 W Joshua Blvd
- 6491 W Linda Ln
- 6450 W Gary Dr
- 5882 W Mercury Way
- 5718 W Ivanhoe St
- 5714 W Ivanhoe St
- 5730 W Ivanhoe St
- 5723 W Ivanhoe St
- 5710 W Ivanhoe St
- 5717 W Ivanhoe St
- 5727 W Ivanhoe St
- 5734 W Ivanhoe St
- 5713 W Ivanhoe St
- 5731 W Ivanhoe St
- 5706 W Ivanhoe St
- 5733 W Ivanhoe St
- 5709 W Ivanhoe St
- 5738 W Ivanhoe St
- 5720 W Harrison St
- 5716 W Harrison St
- 5724 W Harrison St
- 5737 W Ivanhoe St
- 5705 W Ivanhoe St
- 5712 W Harrison St