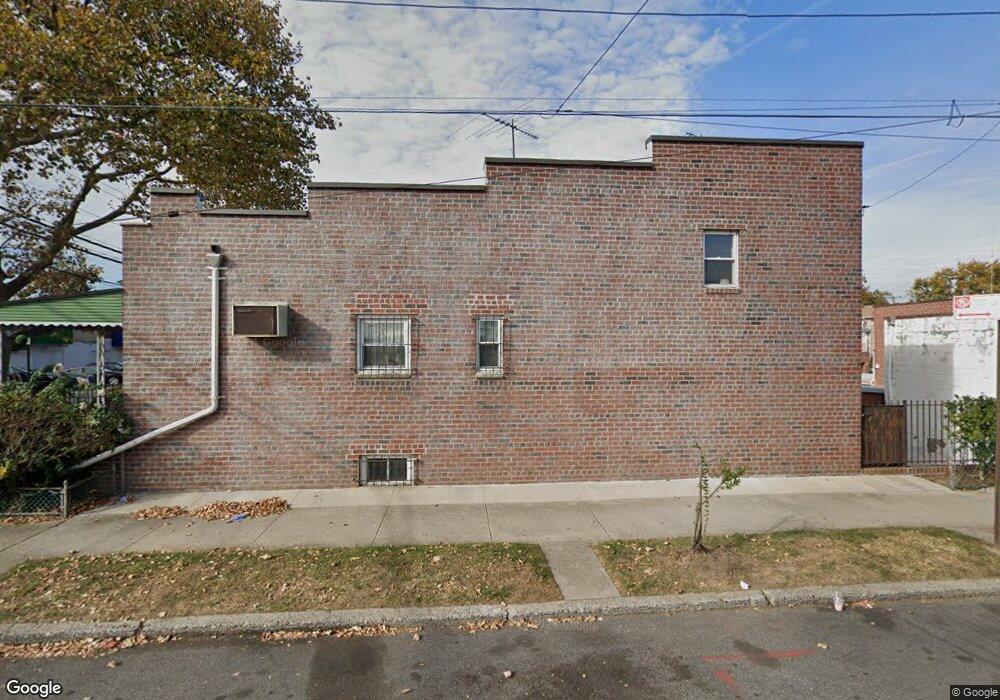
5723 Avenue I Brooklyn, NY 11234
Flatlands NeighborhoodEstimated Value: $617,000 - $766,000
--
Bed
--
Bath
1,230
Sq Ft
$562/Sq Ft
Est. Value
About This Home
This home is located at 5723 Avenue I, Brooklyn, NY 11234 and is currently estimated at $691,134, approximately $561 per square foot. 5723 Avenue I is a home located in Kings County with nearby schools including Success Academy Charter School - Bergen Beach, Christian Heritage Academy, and Great Oaks Elementary School.
Ownership History
Date
Name
Owned For
Owner Type
Purchase Details
Closed on
Jul 26, 2005
Sold by
Friday Ancilla and Friday Crispin
Bought by
Lawrence Janice A
Current Estimated Value
Home Financials for this Owner
Home Financials are based on the most recent Mortgage that was taken out on this home.
Original Mortgage
$100,000
Outstanding Balance
$52,126
Interest Rate
5.54%
Estimated Equity
$639,008
Purchase Details
Closed on
Jul 23, 1996
Sold by
Isaacowitz Janet
Bought by
Friday Crispin and Friday Ancilla
Home Financials for this Owner
Home Financials are based on the most recent Mortgage that was taken out on this home.
Original Mortgage
$149,150
Interest Rate
8.08%
Mortgage Type
Purchase Money Mortgage
Create a Home Valuation Report for This Property
The Home Valuation Report is an in-depth analysis detailing your home's value as well as a comparison with similar homes in the area
Home Values in the Area
Average Home Value in this Area
Purchase History
| Date | Buyer | Sale Price | Title Company |
|---|---|---|---|
| Lawrence Janice A | $370,000 | -- | |
| Lawrence Janice A | $370,000 | -- | |
| Friday Crispin | $157,000 | First American Title Ins Co | |
| Friday Crispin | $157,000 | First American Title Ins Co |
Source: Public Records
Mortgage History
| Date | Status | Borrower | Loan Amount |
|---|---|---|---|
| Open | Lawrence Janice A | $100,000 | |
| Closed | Lawrence Janice A | $100,000 | |
| Open | Lawrence Janice A | $230,000 | |
| Closed | Lawrence Janice A | $230,000 | |
| Previous Owner | Friday Crispin | $149,150 |
Source: Public Records
Tax History Compared to Growth
Tax History
| Year | Tax Paid | Tax Assessment Tax Assessment Total Assessment is a certain percentage of the fair market value that is determined by local assessors to be the total taxable value of land and additions on the property. | Land | Improvement |
|---|---|---|---|---|
| 2025 | $1,805 | $45,000 | $7,380 | $37,620 |
| 2024 | $1,805 | $38,880 | $7,380 | $31,500 |
| 2023 | $4,870 | $39,180 | $7,380 | $31,800 |
| 2022 | $4,493 | $35,820 | $7,380 | $28,440 |
| 2021 | $4,458 | $38,760 | $7,380 | $31,380 |
| 2020 | $2,082 | $35,640 | $7,380 | $28,260 |
| 2019 | $4,165 | $35,940 | $7,380 | $28,560 |
| 2018 | $4,014 | $21,151 | $6,194 | $14,957 |
| 2017 | $3,768 | $19,954 | $7,012 | $12,942 |
| 2016 | $3,453 | $18,825 | $6,241 | $12,584 |
| 2015 | $2,459 | $17,760 | $8,220 | $9,540 |
| 2014 | $2,459 | $17,760 | $8,220 | $9,540 |
Source: Public Records
Map
Nearby Homes
- 858 E 59th St
- 825 E 57th St
- 1165 E 54th St Unit 4K
- 1165 E 54th St Unit 2Z
- 1165 E 54th St Unit 4R
- 1165 E 54th St Unit 5U
- 1165 E 54th St Unit 1Z
- 1165 E 54th St Unit 3-K
- 1165 E 54th St Unit 6Z
- 1165 E 54th St Unit 7Z
- 1165 E 54th St Unit 6D
- 1165 E 54th St Unit 3S
- 1165 E 54th St Unit 2X
- 1199 E 53rd St Unit 3O
- 1199 E 53rd St Unit 1L
- 1199 E 53rd St Unit 2X
- 1199 E 53rd St Unit 1D
- 1199 E 53rd St Unit 5C
- 1199 E 53 St Unit 1L
- 1184 E 54th St