Estimated Value: $411,000 - $440,446
5
Beds
2
Baths
2,000
Sq Ft
$212/Sq Ft
Est. Value
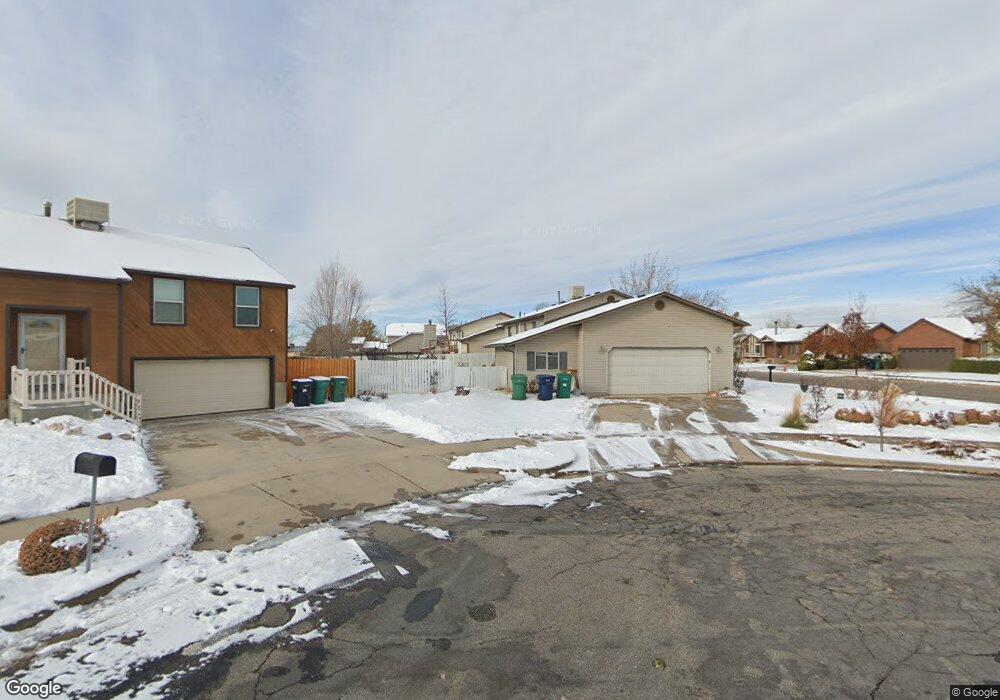
About This Home
This home is located at 5723 S 3975 W, Roy, UT 84067 and is currently estimated at $424,862, approximately $212 per square foot. 5723 S 3975 W is a home located in Weber County with nearby schools including Freedom School, Roy Junior High School, and Roy High School.
Ownership History
Date
Name
Owned For
Owner Type
Purchase Details
Closed on
Jul 21, 2016
Bought by
Stone Jeremy
Current Estimated Value
Home Financials for this Owner
Home Financials are based on the most recent Mortgage that was taken out on this home.
Original Mortgage
$156,900
Outstanding Balance
$124,726
Interest Rate
3.45%
Estimated Equity
$300,136
Purchase Details
Closed on
Jun 25, 2008
Sold by
Young Misti L and Young Misty L
Bought by
Young Misti L
Purchase Details
Closed on
Dec 13, 2002
Sold by
Nielson Nathan T and Nielson Kate W
Bought by
Young Misty L
Purchase Details
Closed on
Mar 11, 1998
Sold by
Rogerson Judy L
Bought by
Nielson Nathan T and Nielson Kate W
Home Financials for this Owner
Home Financials are based on the most recent Mortgage that was taken out on this home.
Original Mortgage
$103,374
Interest Rate
7.11%
Mortgage Type
FHA
Create a Home Valuation Report for This Property
The Home Valuation Report is an in-depth analysis detailing your home's value as well as a comparison with similar homes in the area
Home Values in the Area
Average Home Value in this Area
Purchase History
| Date | Buyer | Sale Price | Title Company |
|---|---|---|---|
| Stone Jeremy | -- | -- | |
| Young Misti L | -- | Us Title Utah | |
| Young Misty L | -- | Backman Stewart Title | |
| Nielson Nathan T | -- | Associated Title Company |
Source: Public Records
Mortgage History
| Date | Status | Borrower | Loan Amount |
|---|---|---|---|
| Open | Stone Jeremy | $156,900 | |
| Closed | Stone Jeremy | -- | |
| Previous Owner | Nielson Nathan T | $103,374 |
Source: Public Records
Tax History
| Year | Tax Paid | Tax Assessment Tax Assessment Total Assessment is a certain percentage of the fair market value that is determined by local assessors to be the total taxable value of land and additions on the property. | Land | Improvement |
|---|---|---|---|---|
| 2025 | $2,354 | $416,969 | $135,000 | $281,969 |
| 2024 | $2,275 | $223,299 | $74,257 | $149,042 |
| 2023 | $2,047 | $201,300 | $65,968 | $135,332 |
| 2022 | $2,262 | $226,600 | $60,501 | $166,099 |
| 2021 | $1,697 | $282,000 | $80,017 | $201,983 |
| 2020 | $1,616 | $246,000 | $80,017 | $165,983 |
| 2019 | $1,614 | $232,000 | $45,048 | $186,952 |
| 2018 | $1,501 | $204,000 | $39,924 | $164,076 |
| 2017 | $1,413 | $181,000 | $39,924 | $141,076 |
| 2016 | $1,295 | $89,443 | $21,415 | $68,028 |
| 2015 | $1,120 | $79,822 | $21,415 | $58,407 |
| 2014 | $1,133 | $79,822 | $18,611 | $61,211 |
Source: Public Records
Map
Nearby Homes
- 5773 S 3850 W
- 5856 S 3950 W
- 3826 W 5750 S
- 3832 W 5625 S
- 5444 S 4050 W
- 5412 S 3925 W
- 4264 W 6025 S
- 4276 W 6025 S
- 4403 W 5700 S
- 6052 S 4275 W
- 4309 W 5430 St #B S
- 4450 W 5775 S
- 4239 W 5325 S
- 3016 W 2650 N
- 3186 W 2600 N
- 2216 W 2615 N Unit 142
- 2208 W 2615 N
- 2208 W 2615 N Unit 141
- 5854 S 3500 W
- 2186 W 2615 N
Your Personal Tour Guide
Ask me questions while you tour the home.