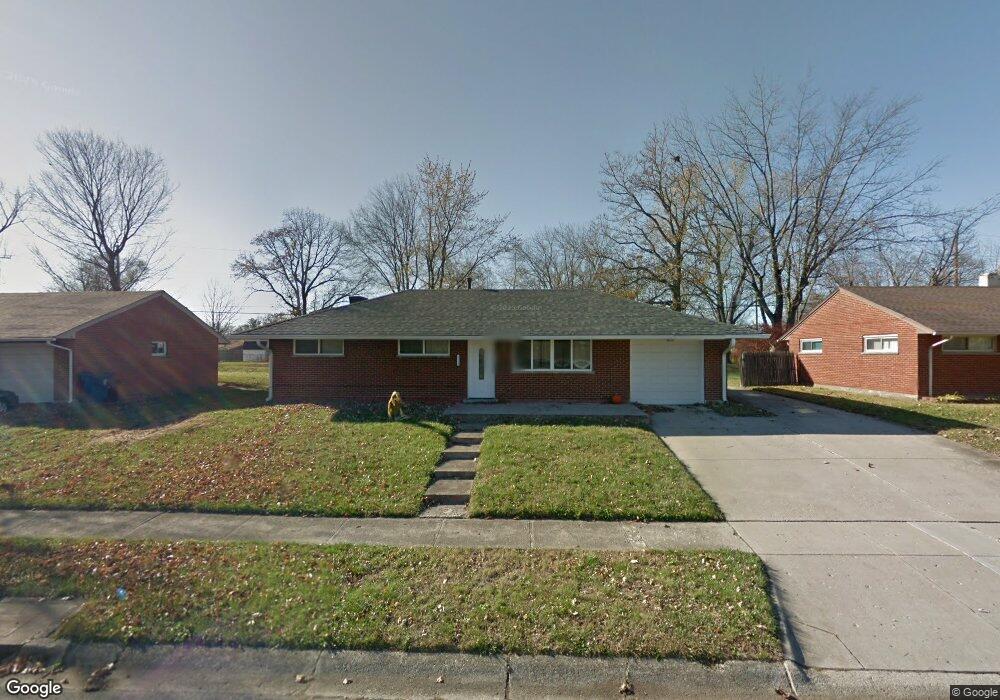
5723 Tomberg St Dayton, OH 45424
Estimated Value: $223,000 - $253,000
4
Beds
3
Baths
1,704
Sq Ft
$139/Sq Ft
Est. Value
About This Home
This home is located at 5723 Tomberg St, Dayton, OH 45424 and is currently estimated at $237,307, approximately $139 per square foot. 5723 Tomberg St is a home located in Montgomery County with nearby schools including Wayne High School and Huber Heights Christian Academy.
Ownership History
Date
Name
Owned For
Owner Type
Purchase Details
Closed on
Mar 29, 2012
Sold by
Raines Walter L and Raines Pamela J
Bought by
Mcadoo Andrew M and Mcadoo Jessica A
Current Estimated Value
Home Financials for this Owner
Home Financials are based on the most recent Mortgage that was taken out on this home.
Original Mortgage
$96,977
Outstanding Balance
$66,951
Interest Rate
3.9%
Mortgage Type
FHA
Estimated Equity
$170,356
Purchase Details
Closed on
Oct 18, 2010
Sold by
Dunlevey Zachariah
Bought by
U S Bank National Association
Purchase Details
Closed on
Apr 17, 2006
Sold by
Va
Bought by
Dunlevey Zachariah
Home Financials for this Owner
Home Financials are based on the most recent Mortgage that was taken out on this home.
Original Mortgage
$19,500
Interest Rate
6.37%
Mortgage Type
Stand Alone Second
Purchase Details
Closed on
Jan 14, 2005
Sold by
Baker John A
Bought by
Va
Create a Home Valuation Report for This Property
The Home Valuation Report is an in-depth analysis detailing your home's value as well as a comparison with similar homes in the area
Home Values in the Area
Average Home Value in this Area
Purchase History
| Date | Buyer | Sale Price | Title Company |
|---|---|---|---|
| Mcadoo Andrew M | $99,500 | Home Services Title Llc | |
| U S Bank National Association | $66,000 | Attorney | |
| Dunlevey Zachariah | -- | None Available | |
| Va | $84,605 | None Available |
Source: Public Records
Mortgage History
| Date | Status | Borrower | Loan Amount |
|---|---|---|---|
| Open | Mcadoo Andrew M | $96,977 | |
| Previous Owner | Dunlevey Zachariah | $19,500 |
Source: Public Records
Tax History Compared to Growth
Tax History
| Year | Tax Paid | Tax Assessment Tax Assessment Total Assessment is a certain percentage of the fair market value that is determined by local assessors to be the total taxable value of land and additions on the property. | Land | Improvement |
|---|---|---|---|---|
| 2024 | $3,234 | $62,840 | $10,010 | $52,830 |
| 2023 | $3,234 | $62,840 | $10,010 | $52,830 |
| 2022 | $2,870 | $43,900 | $7,000 | $36,900 |
| 2021 | $2,906 | $43,900 | $7,000 | $36,900 |
| 2020 | $2,905 | $43,900 | $7,000 | $36,900 |
| 2019 | $2,748 | $36,700 | $7,000 | $29,700 |
| 2018 | $2,757 | $36,700 | $7,000 | $29,700 |
| 2017 | $2,738 | $36,700 | $7,000 | $29,700 |
| 2016 | $2,600 | $33,950 | $7,000 | $26,950 |
| 2015 | $2,608 | $33,950 | $7,000 | $26,950 |
| 2014 | $2,608 | $33,950 | $7,000 | $26,950 |
| 2012 | -- | $36,930 | $8,750 | $28,180 |
Source: Public Records
Map
Nearby Homes
- 5660 Tomberg St
- 5669 Traymore Dr
- 5784 Pennywell Dr
- 5848 Tomberg St
- 5952 Tibet Dr
- 5433 Pentland Cir
- 5004 Fishburg Rd
- 5560 Harshmanville Rd
- 4848 Rittenhouse Dr
- 5983 Harshmanville Rd
- 4608 Nowak Ave
- 5365 Mariner Dr
- 5159 Fishburg Rd
- 5720 Old Troy Pike
- 5080 Tilbury Rd
- 5431 Naughton Dr
- 4918 Powell Rd
- 4407 Nowak Ave
- 5455 Naughton Dr
- 4309 Kitridge Rd
- 5733 Tomberg St
- 5713 Tomberg St
- 5743 Tomberg St
- 5724 Tomberg St
- 5714 Tomberg St
- 5734 Tomberg St
- 5704 Tomberg St
- 4943 Pennswood Dr
- 4937 Pennswood Dr
- 5753 Tomberg St
- 5697 Tomberg St
- 5744 Tomberg St
- 4949 Pennswood Dr
- 4931 Pennswood Dr
- 5696 Tomberg St
- 5725 Tibet Dr
- 5715 Tibet Dr
- 5735 Tibet Dr
- 5754 Tomberg St
- 5705 Tibet Dr