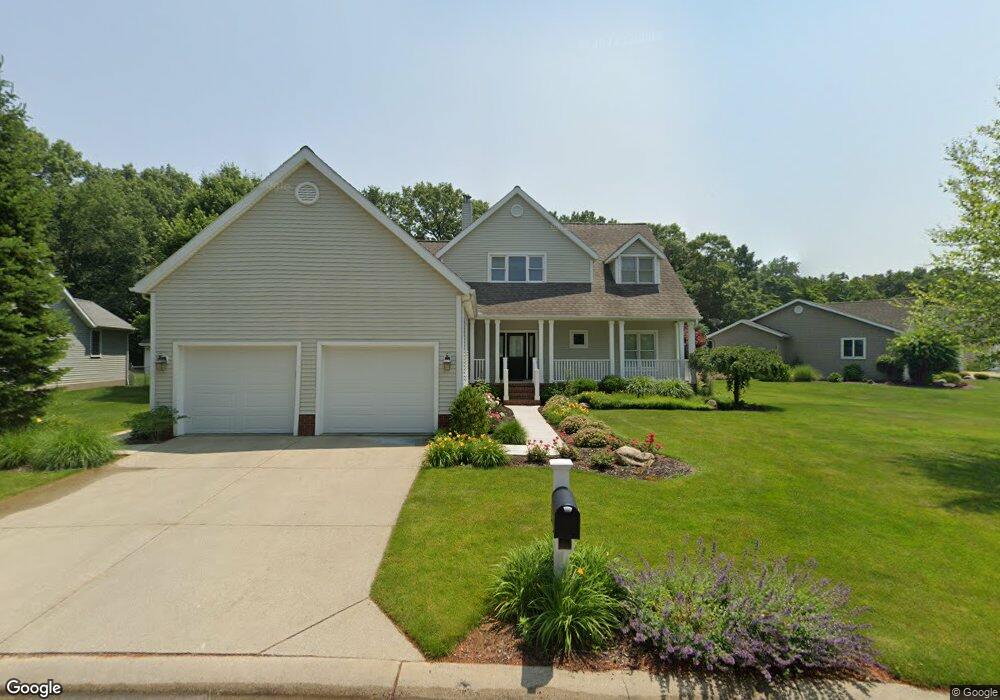
57238 Fallen Timber Ct South Bend, IN 46619
Estimated Value: $325,000 - $401,000
4
Beds
2
Baths
2,908
Sq Ft
$127/Sq Ft
Est. Value
About This Home
This home is located at 57238 Fallen Timber Ct, South Bend, IN 46619 and is currently estimated at $368,230, approximately $126 per square foot. 57238 Fallen Timber Ct is a home located in St. Joseph County with nearby schools including Wilson Elementary School, Clay Intermediate Center, and Navarre Middle School.
Ownership History
Date
Name
Owned For
Owner Type
Purchase Details
Closed on
Dec 27, 2022
Sold by
Witek Paul Michael and Witek Ann Marie
Bought by
Hackett Joshua J and Hackett Anna C
Current Estimated Value
Home Financials for this Owner
Home Financials are based on the most recent Mortgage that was taken out on this home.
Original Mortgage
$313,000
Outstanding Balance
$302,675
Interest Rate
6.61%
Mortgage Type
VA
Estimated Equity
$65,555
Purchase Details
Closed on
Dec 23, 2022
Sold by
Witek Paul Michael Le
Bought by
Hackett Joshua J and Hackett Anna C
Home Financials for this Owner
Home Financials are based on the most recent Mortgage that was taken out on this home.
Original Mortgage
$313,000
Outstanding Balance
$302,675
Interest Rate
6.61%
Mortgage Type
VA
Estimated Equity
$65,555
Purchase Details
Closed on
May 4, 2018
Sold by
Witek Paul M and Witek Ann M
Bought by
Witek Paul Michael and Mar Ann
Create a Home Valuation Report for This Property
The Home Valuation Report is an in-depth analysis detailing your home's value as well as a comparison with similar homes in the area
Purchase History
| Date | Buyer | Sale Price | Title Company |
|---|---|---|---|
| Hackett Joshua J | -- | Metropolitan Title | |
| Hackett Joshua J | -- | Metropolitan Title | |
| Witek Paul Michael | -- | None Listed On Document |
Source: Public Records
Mortgage History
| Date | Status | Borrower | Loan Amount |
|---|---|---|---|
| Open | Hackett Joshua J | $313,000 | |
| Closed | Hackett Joshua J | $313,000 |
Source: Public Records
Tax History Compared to Growth
Tax History
| Year | Tax Paid | Tax Assessment Tax Assessment Total Assessment is a certain percentage of the fair market value that is determined by local assessors to be the total taxable value of land and additions on the property. | Land | Improvement |
|---|---|---|---|---|
| 2024 | $3,281 | $311,200 | $60,600 | $250,600 |
| 2023 | $3,206 | $279,100 | $60,600 | $218,500 |
| 2022 | $3,206 | $263,800 | $60,600 | $203,200 |
| 2021 | $2,723 | $221,400 | $31,600 | $189,800 |
| 2020 | $2,596 | $211,400 | $30,200 | $181,200 |
| 2019 | $1,924 | $188,100 | $26,900 | $161,200 |
| 2018 | $2,115 | $193,300 | $27,400 | $165,900 |
| 2017 | $2,144 | $189,700 | $27,400 | $162,300 |
| 2016 | $1,865 | $168,600 | $23,800 | $144,800 |
| 2014 | $1,874 | $166,500 | $23,800 | $142,700 |
Source: Public Records
Map
Nearby Homes
- 57210 White Pine Trail
- 57115 White Pine Trail
- 26541 Gaited Horse Trail
- 57845 Crumstown Hwy
- 26265 Whippoorwill Dr
- 55629 Cardinal Dr
- 26366 Hummingbird Rd
- 24760 Lancer Dr
- 55915 Dorn St
- 55335 Quince Rd
- 25260 Fillmore Rd
- 54962 Quince Rd
- 56825 Elmer Ave
- 55905 Wright Rd
- 56131 Butternut Rd
- 54520 Norwood Dr
- 54483 Whitesell Dr
- 55075 Sundown Rd
- 26077 Kenwood Dr
- 0 Lakewood Dr
- 57258 Pine View Dr
- 57218 Fallen Timber Ct
- 57229 Fallen Timber Ct
- 57263 Pine View Dr
- 57270 Pine View Dr
- 57208 Fallen Timber Ct
- 57239 Pine View Dr
- 57201 Fallen Timber Ct
- 57279 Pine View Dr
- 57195 Fallen Timber Ct
- 57290 Pine View Dr
- 57200 Pine View Dr
- 57295 Pine View Dr
- 26348 Scotch Pine Trail
- 57182 Pine View Dr
- 26266 Klem Dr
- 57160 Pine View Dr
- 57316 Pine View Dr
- 57315 Pine View Dr
- 57205 Pine View Dr