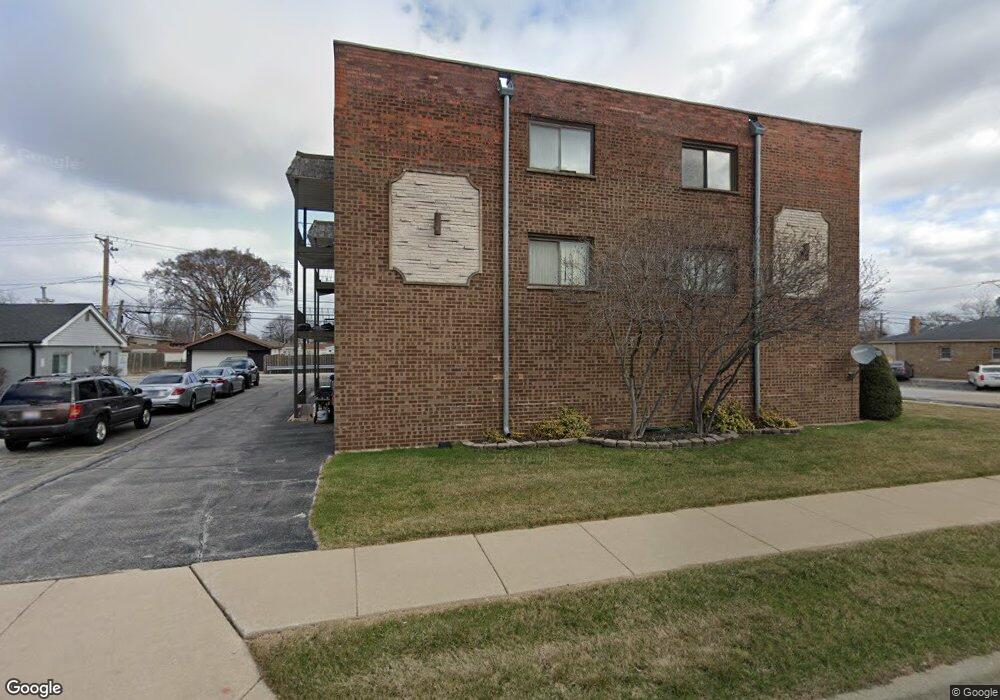
5724 111th St Unit 1B Chicago Ridge, IL 60415
Estimated Value: $113,321 - $159,000
1
Bed
1
Bath
750
Sq Ft
$184/Sq Ft
Est. Value
About This Home
This home is located at 5724 111th St Unit 1B, Chicago Ridge, IL 60415 and is currently estimated at $138,330, approximately $184 per square foot. 5724 111th St Unit 1B is a home located in Cook County with nearby schools including Ridge Central Elementary School, Elden D Finley Jr High School, and Harold L. Richards High School.
Ownership History
Date
Name
Owned For
Owner Type
Purchase Details
Closed on
Nov 6, 2014
Sold by
Chicago Title Land Trust Company
Bought by
38Th Street Investments Llc
Current Estimated Value
Purchase Details
Closed on
Dec 24, 2009
Sold by
Buschbach James A and Buschbach Joan H
Bought by
Chicago Title Land Trust Company and Trust #2273
Purchase Details
Closed on
Jul 28, 2009
Sold by
Signorelli Steven
Bought by
Buschbach James A and James A Buschbach Trust
Purchase Details
Closed on
Aug 27, 2007
Sold by
Maynard Cynthia
Bought by
Signorelli Steven
Home Financials for this Owner
Home Financials are based on the most recent Mortgage that was taken out on this home.
Original Mortgage
$100,000
Interest Rate
6.79%
Mortgage Type
Unknown
Purchase Details
Closed on
Jun 30, 2006
Sold by
Buschbach Builders Inc
Bought by
Maynard Cynthia
Create a Home Valuation Report for This Property
The Home Valuation Report is an in-depth analysis detailing your home's value as well as a comparison with similar homes in the area
Home Values in the Area
Average Home Value in this Area
Purchase History
| Date | Buyer | Sale Price | Title Company |
|---|---|---|---|
| 38Th Street Investments Llc | -- | Chicago Title Land Trust Co | |
| Chicago Title Land Trust Company | -- | None Available | |
| Buschbach James A | -- | None Available | |
| Signorelli Steven | $105,000 | Ticor Title | |
| Maynard Cynthia | $50,000 | Pntn |
Source: Public Records
Mortgage History
| Date | Status | Borrower | Loan Amount |
|---|---|---|---|
| Previous Owner | Signorelli Steven | $100,000 |
Source: Public Records
Tax History Compared to Growth
Tax History
| Year | Tax Paid | Tax Assessment Tax Assessment Total Assessment is a certain percentage of the fair market value that is determined by local assessors to be the total taxable value of land and additions on the property. | Land | Improvement |
|---|---|---|---|---|
| 2024 | $2,917 | $8,996 | $586 | $8,410 |
| 2023 | $1,487 | $8,996 | $586 | $8,410 |
| 2022 | $1,487 | $3,795 | $781 | $3,014 |
| 2021 | $1,422 | $3,794 | $781 | $3,013 |
| 2020 | $1,405 | $3,794 | $781 | $3,013 |
| 2019 | $1,605 | $4,109 | $707 | $3,402 |
| 2018 | $1,526 | $4,109 | $707 | $3,402 |
| 2017 | $1,528 | $4,109 | $707 | $3,402 |
| 2016 | $2,004 | $5,023 | $585 | $4,438 |
| 2015 | $1,966 | $5,023 | $585 | $4,438 |
| 2014 | $1,925 | $5,023 | $585 | $4,438 |
| 2013 | $2,488 | $7,137 | $585 | $6,552 |
Source: Public Records
Map
Nearby Homes
- 11013 Menard Ave
- 5730 110th St
- 11010 Central Ave Unit 3A
- 11000 Central Ave Unit 2C
- 10930 Central Ave Unit 1B
- 5825 109th St
- 11024 Mason Ave
- 10832 Massasoit Ave
- 5924 W 109th St
- 6040 111th St
- 10925 Mcvicker Ave
- 10755 Mason Ave
- 10925 Lyman Ave
- 10710 Central Ave Unit 3D
- 10937 Moody Ave
- 10854 Lyman Ave
- 5810 107th Court Way
- 10624 S Central Ave Unit 1
- 10620 S Central Ave Unit 1A
- 10620 S Central Ave Unit 3A
- 5724 111th St Unit 1A
- 5724 111th St Unit 1D
- 5724 111th St Unit 3D
- 5724 111th St Unit 3C
- 5724 111th St Unit 2D
- 5724 111th St Unit 2C
- 5724 111th St Unit 2B
- 5724 111th St Unit 2A
- 5724 111th St Unit 1C
- 5724 111th St Unit 3B
- 5724 111th St
- 5724 W 111th St Unit 3D
- 5724 W 111th St Unit 2D
- 5724 W 111th St Unit 1C
- 5724 W 111th St Unit 3A
- 5724 W 111th St Unit 1A
- 5724 W 111th St Unit 1D
- 5724 W 111th St Unit 3B
- 5724 W 111th St
- 5730 111th St