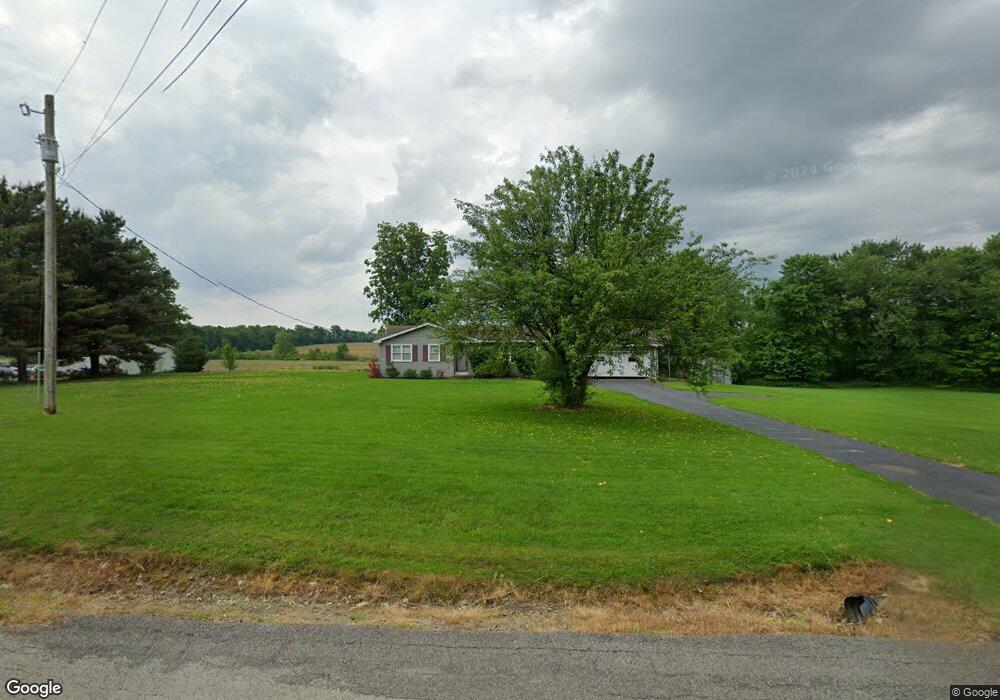
5725 W Middletown Rd Canfield, OH 44406
Estimated Value: $218,000 - $316,000
2
Beds
2
Baths
1,300
Sq Ft
$210/Sq Ft
Est. Value
About This Home
This home is located at 5725 W Middletown Rd, Canfield, OH 44406 and is currently estimated at $273,251, approximately $210 per square foot. 5725 W Middletown Rd is a home located in Mahoning County with nearby schools including South Range Elementary School, South Range Middle School, and South Range High School.
Ownership History
Date
Name
Owned For
Owner Type
Purchase Details
Closed on
May 16, 2004
Sold by
Lucicosky Richard J and Lewis Amanda R
Bought by
Barta David A
Current Estimated Value
Home Financials for this Owner
Home Financials are based on the most recent Mortgage that was taken out on this home.
Original Mortgage
$116,000
Outstanding Balance
$65,908
Interest Rate
8.62%
Mortgage Type
Purchase Money Mortgage
Estimated Equity
$207,343
Purchase Details
Closed on
Sep 9, 2000
Sold by
Steenge John W and Steenge Jill A
Bought by
Lucicosky Richard J and Lewis Amanda R
Home Financials for this Owner
Home Financials are based on the most recent Mortgage that was taken out on this home.
Original Mortgage
$82,400
Interest Rate
8.05%
Purchase Details
Closed on
Jun 1, 1988
Bought by
Steenge John W and Steenge Jill A
Create a Home Valuation Report for This Property
The Home Valuation Report is an in-depth analysis detailing your home's value as well as a comparison with similar homes in the area
Home Values in the Area
Average Home Value in this Area
Purchase History
| Date | Buyer | Sale Price | Title Company |
|---|---|---|---|
| Barta David A | $116,000 | -- | |
| Lucicosky Richard J | $103,000 | -- | |
| Steenge John W | $57,500 | -- |
Source: Public Records
Mortgage History
| Date | Status | Borrower | Loan Amount |
|---|---|---|---|
| Open | Barta David A | $116,000 | |
| Previous Owner | Lucicosky Richard J | $82,400 |
Source: Public Records
Tax History Compared to Growth
Tax History
| Year | Tax Paid | Tax Assessment Tax Assessment Total Assessment is a certain percentage of the fair market value that is determined by local assessors to be the total taxable value of land and additions on the property. | Land | Improvement |
|---|---|---|---|---|
| 2024 | $2,618 | $56,770 | $10,530 | $46,240 |
| 2023 | $2,627 | $56,770 | $10,530 | $46,240 |
| 2022 | $2,624 | $49,150 | $9,250 | $39,900 |
| 2021 | $2,557 | $49,150 | $9,250 | $39,900 |
| 2020 | $2,569 | $49,150 | $9,250 | $39,900 |
| 2019 | $2,237 | $40,920 | $9,250 | $31,670 |
| 2018 | $2,245 | $40,920 | $9,250 | $31,670 |
| 2017 | $2,168 | $40,920 | $9,250 | $31,670 |
| 2016 | $2,095 | $37,390 | $9,970 | $27,420 |
| 2015 | $2,020 | $37,390 | $9,970 | $27,420 |
| 2014 | $2,061 | $37,390 | $9,970 | $27,420 |
| 2013 | $2,046 | $37,390 | $9,970 | $27,420 |
Source: Public Records
Map
Nearby Homes
- 5779 W Middletown Rd
- 6604 W Middletown Rd
- 11375 Fox Run Ln
- 10396 Detwiler Rd
- 11158 Detwiler Rd
- 7060 W South Range Rd
- 7145 W South Range Rd
- 12157 Columbiana Canfield Rd
- 10473 Lisbon Rd
- 9256 Columbiana Canfield Rd
- 6605 Covington Cove
- 3555 W South Range Rd
- 3079 W South Range Rd
- 9974 New Buffalo Rd
- 8475 Youngstown - Salem Rd
- 3396 W Western Reserve Rd
- 2680 W South Range Rd
- 9501 New Buffalo Rd
- 8015 Briarwood Ct Unit 6
- 8000 Briarwood Ct Unit 22
- 5655 W Middletown Rd
- 5710 W Middletown Rd
- 5620 W Middletown Rd
- 5686 W Middletown Rd
- 5633 W Middletown Rd
- 5644 W Middletown Rd
- 5801 W Middletown Rd
- 5630 W Middletown Rd
- 5585 W Middletown Rd
- 5685 Timberwood Trail
- 5600 W Middletown Rd
- 5874 W Middletown Rd
- 5645 Timberwood Trail
- 5869 W Middletown Rd
- 5549 W Middletown Rd
- 5570 W Middletown Rd
- 10920 Shadow Wood Ln
- 5585 Timberwood Trail
- 5895 W Middletown Rd
- 10901 Shadow Wood Ln