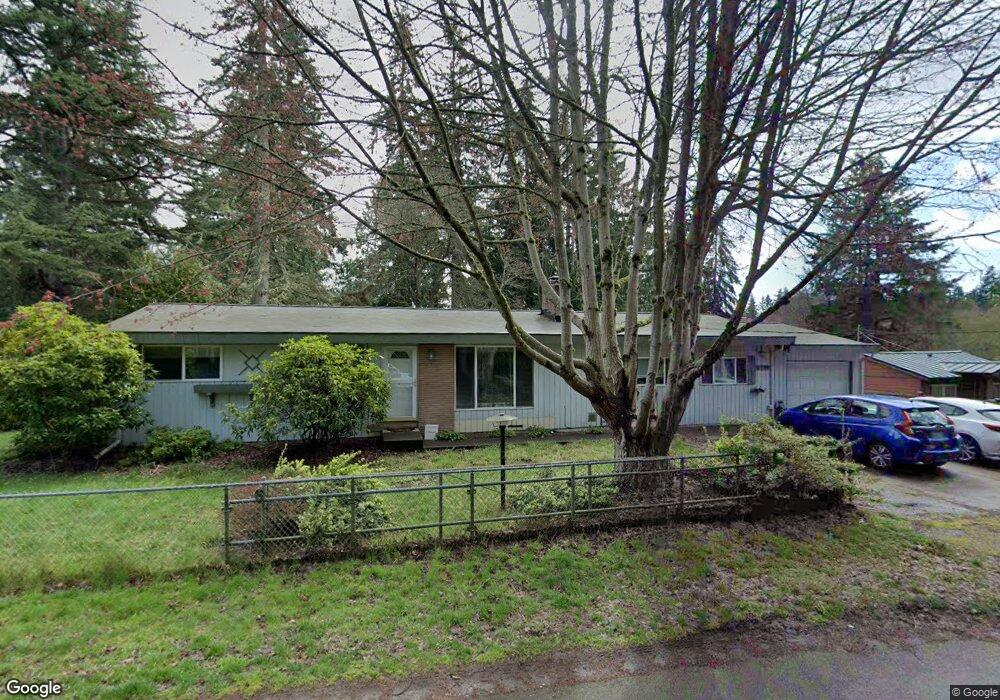
5728 156th St SW Edmonds, WA 98026
Estimated Value: $759,062 - $901,000
3
Beds
2
Baths
1,664
Sq Ft
$494/Sq Ft
Est. Value
About This Home
This home is located at 5728 156th St SW, Edmonds, WA 98026 and is currently estimated at $821,266, approximately $493 per square foot. 5728 156th St SW is a home located in Snohomish County with nearby schools including Beverly Elementary School, Meadowdale Middle School, and Meadowdale High School.
Ownership History
Date
Name
Owned For
Owner Type
Purchase Details
Closed on
Aug 23, 2017
Sold by
Mertens David E
Bought by
Xavier Michael
Current Estimated Value
Home Financials for this Owner
Home Financials are based on the most recent Mortgage that was taken out on this home.
Original Mortgage
$378,000
Outstanding Balance
$315,412
Interest Rate
3.96%
Mortgage Type
New Conventional
Estimated Equity
$505,854
Purchase Details
Closed on
Jan 7, 2008
Sold by
Chase Gordon L and Wiley Chase Dylis G
Bought by
Mertens David E
Home Financials for this Owner
Home Financials are based on the most recent Mortgage that was taken out on this home.
Original Mortgage
$331,987
Interest Rate
6.05%
Mortgage Type
VA
Purchase Details
Closed on
Aug 2, 2004
Sold by
Miner Eric C
Bought by
Karls Donna K
Purchase Details
Closed on
Jul 30, 2004
Sold by
Karls Donna K
Bought by
Chase Gordon L and Wiley Chase Dylis G
Create a Home Valuation Report for This Property
The Home Valuation Report is an in-depth analysis detailing your home's value as well as a comparison with similar homes in the area
Home Values in the Area
Average Home Value in this Area
Purchase History
| Date | Buyer | Sale Price | Title Company |
|---|---|---|---|
| Xavier Michael | $420,000 | First American Title Ins Co | |
| Mertens David E | $325,000 | Chicago Title | |
| Karls Donna K | $11,235 | Ort | |
| Chase Gordon L | $255,000 | Ort |
Source: Public Records
Mortgage History
| Date | Status | Borrower | Loan Amount |
|---|---|---|---|
| Open | Xavier Michael | $378,000 | |
| Previous Owner | Mertens David E | $331,987 |
Source: Public Records
Tax History Compared to Growth
Tax History
| Year | Tax Paid | Tax Assessment Tax Assessment Total Assessment is a certain percentage of the fair market value that is determined by local assessors to be the total taxable value of land and additions on the property. | Land | Improvement |
|---|---|---|---|---|
| 2025 | $5,294 | $649,300 | $429,700 | $219,600 |
| 2024 | $5,294 | $634,800 | $415,200 | $219,600 |
| 2023 | $5,404 | $677,500 | $420,000 | $257,500 |
| 2022 | $5,026 | $512,800 | $301,200 | $211,600 |
| 2020 | $4,861 | $438,600 | $252,700 | $185,900 |
| 2019 | $4,593 | $412,300 | $229,900 | $182,400 |
| 2018 | $4,696 | $371,700 | $209,000 | $162,700 |
| 2017 | $3,967 | $324,400 | $174,800 | $149,600 |
| 2016 | $3,644 | $298,600 | $154,900 | $143,700 |
| 2015 | $3,500 | $272,300 | $144,400 | $127,900 |
| 2013 | $2,840 | $208,500 | $116,000 | $92,500 |
Source: Public Records
Map
Nearby Homes
- 5727 160th St SW
- 5725 160th St SW
- 5921 160th St SW
- 5719 160th St SW
- Indigo Plan at Edmonds Ridge
- Lotus Plan at Edmonds Ridge
- Spirea Plan at Edmonds Ridge
- Verbena Plan at Edmonds Ridge
- Azalea Plan at Edmonds Ridge
- Ivy Plan at Edmonds Ridge
- 5728 160th St SW
- 5714 160th St SW
- 5712 160th St SW
- 16027 57th Ave W
- 16033 57th Ave W
- 5411 158th Place SW
- 15424 61st Place W
- 5404 158th Place SW
- 5724 161st St SW
- 15914 52nd Ave W
- 15614 57th Place W
- 5806 156th St SW
- 5712 156th St SW
- 15622 57th Place W
- 5818 156th St SW
- 5729 156th St SW
- 5727 156th St SW
- 5804 156th St SW
- 15617 57th Place W
- 5805 156th St SW
- 5706 156th St SW
- 15630 57th Place W
- 5717 156th St SW
- 15627 57th Place W
- 5809 156th St SW
- 5820 156th St SW
- 15631 58th Place W
- 5822 156th St SW
- 5630 156th St SW
- 15704 57th Place W