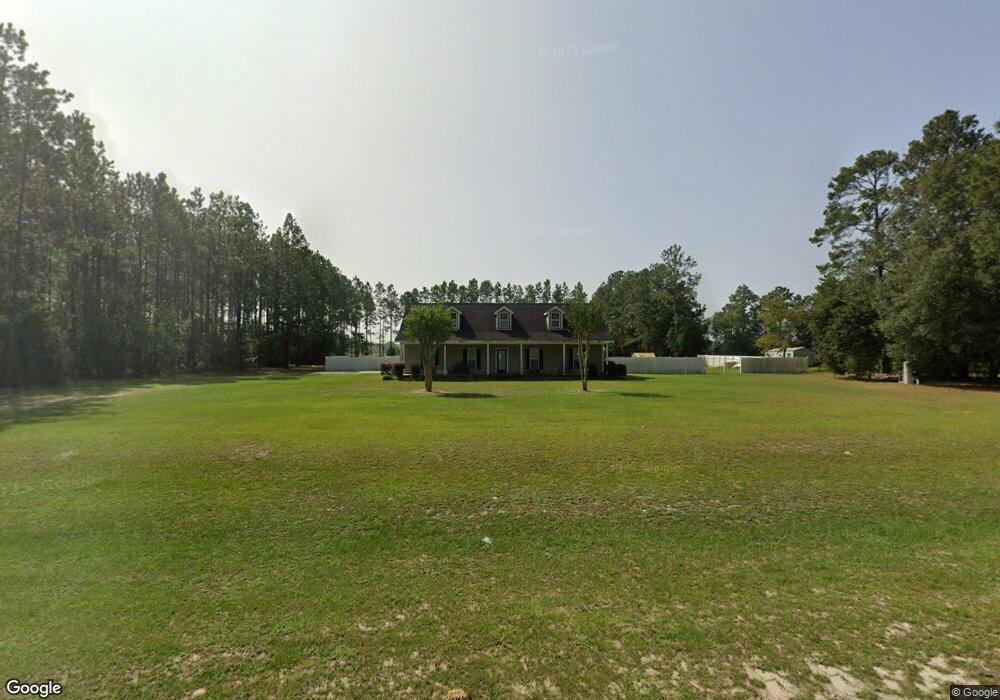
5729 Owens Rd Patterson, GA 31557
Estimated Value: $73,402 - $392,000
4
Beds
3
Baths
1,856
Sq Ft
$135/Sq Ft
Est. Value
About This Home
This home is located at 5729 Owens Rd, Patterson, GA 31557 and is currently estimated at $250,134, approximately $134 per square foot. 5729 Owens Rd is a home located in Pierce County with nearby schools including Pierce County High School.
Ownership History
Date
Name
Owned For
Owner Type
Purchase Details
Closed on
May 17, 2019
Sold by
Murray Jerry L
Bought by
Murray Timothy L
Current Estimated Value
Purchase Details
Closed on
Apr 30, 2012
Sold by
Federal National Mortgage Association
Bought by
Murray Timothy L and Murray April J
Home Financials for this Owner
Home Financials are based on the most recent Mortgage that was taken out on this home.
Original Mortgage
$137,551
Interest Rate
4.01%
Mortgage Type
New Conventional
Purchase Details
Closed on
Sep 6, 2011
Sold by
Crescent Mortgage Company
Bought by
Federal National Mortgage Association
Purchase Details
Closed on
Feb 8, 2002
Sold by
Johnson Donis
Bought by
Johnson Anthony
Purchase Details
Closed on
Mar 3, 1999
Sold by
Johnson Anthony
Bought by
Johnson Donis
Purchase Details
Closed on
Jul 15, 1991
Sold by
Walker A B
Bought by
Johnson Donis and Johnson Anthony
Create a Home Valuation Report for This Property
The Home Valuation Report is an in-depth analysis detailing your home's value as well as a comparison with similar homes in the area
Purchase History
| Date | Buyer | Sale Price | Title Company |
|---|---|---|---|
| Murray Timothy L | $17,000 | -- | |
| Murray Timothy L | -- | -- | |
| Federal National Mortgage Association | $156,251 | -- | |
| Crescent Mortgage Company | $156,251 | -- | |
| Johnson Anthony | -- | -- | |
| Johnson Donis | $3,000 | -- | |
| Johnson Donis | $5,700 | -- |
Source: Public Records
Mortgage History
| Date | Status | Borrower | Loan Amount |
|---|---|---|---|
| Previous Owner | Murray Timothy L | $137,551 |
Source: Public Records
Tax History
| Year | Tax Paid | Tax Assessment Tax Assessment Total Assessment is a certain percentage of the fair market value that is determined by local assessors to be the total taxable value of land and additions on the property. | Land | Improvement |
|---|---|---|---|---|
| 2025 | $282 | $12,056 | $2,646 | $9,410 |
| 2024 | $282 | $12,056 | $2,646 | $9,410 |
| 2023 | $282 | $12,056 | $2,646 | $9,410 |
| 2022 | $185 | $6,846 | $2,257 | $4,589 |
| 2021 | $181 | $6,846 | $2,257 | $4,589 |
| 2020 | $184 | $6,846 | $2,257 | $4,589 |
| 2019 | $186 | $6,846 | $2,257 | $4,589 |
| 2018 | $182 | $6,739 | $2,150 | $4,589 |
| 2017 | $179 | $6,519 | $2,150 | $4,369 |
| 2016 | $178 | $6,519 | $2,150 | $4,369 |
| 2015 | $1,498 | $6,518 | $2,150 | $4,369 |
| 2014 | $1,498 | $6,518 | $2,150 | $4,369 |
| 2013 | $1,498 | $6,518 | $2,149 | $4,368 |
Source: Public Records
Map
Nearby Homes
- 5907 Owens Rd
- 5466 Robin Rd
- 4861 Stanfield Cir
- 5512 Owens Rd
- 0 Otter Creek Rd Unit 23325273
- 4758 Otter Creek Cir
- 4756 Otter Creek Cir
- 4750 Otter Creek Cir
- 5817 Cantrell Rd
- 4725 Otter Creek Cir
- 4720 Otter Creek Cir
- 6204 Cross Swamp Rd
- 3448 Nellie St
- 3440 Nellie St
- 5518 W Railroad Ave
- 3442 Wildwood Ave
- 5772 Industrial Blvd
- 3540 Williams St
- 3501 Martin St
- 0 Trudie Rd
- 5748 Owens Rd
- 5730 Owens Rd
- 5769 Owens Rd
- 5712 Owens Rd
- 5698 Owens Rd
- 5677 Owens Rd
- 5694 Owens Rd
- 5792 Owens Rd
- 5653 Owens Rd
- 5682 Owens Rd
- 5808 Owens Rd
- 5650 Owens Rd
- 5643 Howard Rd
- 5636 Owens Rd
- 5625 Owens Rd
- 5490 Billy Rd
- 0 Stanfield Cir Unit 1642714
- 0 Stanfield Cir Unit 1635709
- 5624 Billy Rd
- 5574 Owens Rd
Your Personal Tour Guide
Ask me questions while you tour the home.