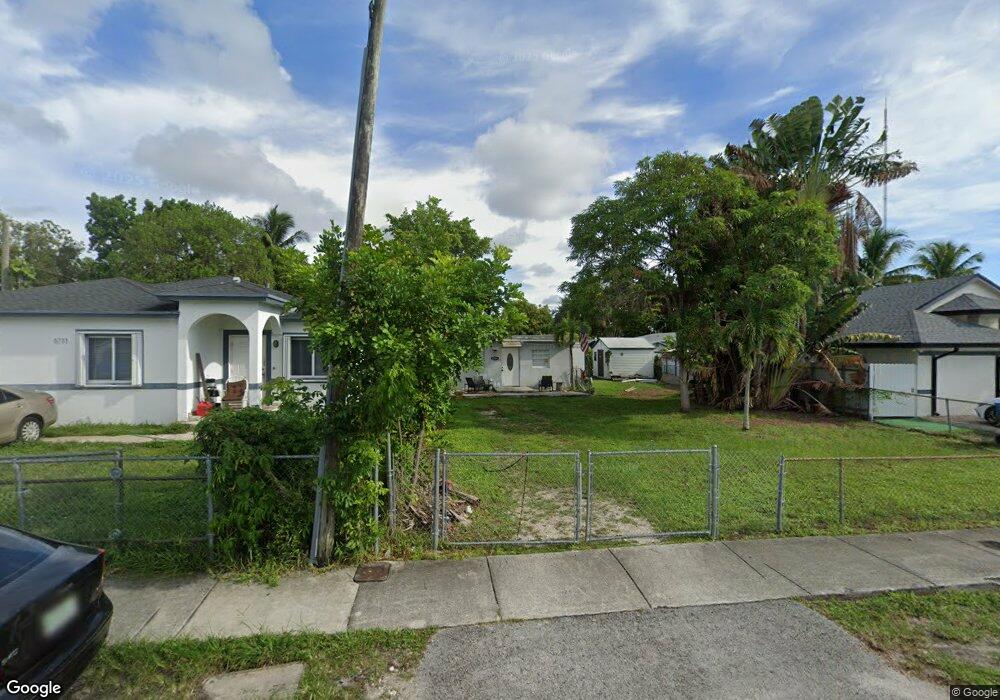
5729 SW 39th St Unit 1 West Park, FL 33023
Estimated Value: $313,000 - $435,000
3
Beds
2
Baths
1,400
Sq Ft
$247/Sq Ft
Est. Value
About This Home
This home is located at 5729 SW 39th St Unit 1, West Park, FL 33023 and is currently estimated at $345,805, approximately $247 per square foot. 5729 SW 39th St Unit 1 is a home located in Broward County with nearby schools including Watkins Elementary School, McNicol Middle School, and Hallandale High School.
Ownership History
Date
Name
Owned For
Owner Type
Purchase Details
Closed on
May 14, 2020
Sold by
Passarelli Giovanni F and Passarelli Beatriz S
Bought by
Passarelli Giovanni Francesco and Passarelli Beatriz Susana
Current Estimated Value
Purchase Details
Closed on
Sep 20, 2017
Sold by
Billingurst Llc
Bought by
Passarelli Giovanni F and Passarelli Beatriz S
Purchase Details
Closed on
Sep 24, 2014
Sold by
Ferrante Nicholas
Bought by
Billingurst Llc
Purchase Details
Closed on
Sep 18, 2014
Sold by
Wells Fargo Bank Na
Bought by
Ferrante Nicholas
Purchase Details
Closed on
May 19, 2011
Sold by
Mendoza Camilo
Bought by
Wells Fargo Bank Na
Purchase Details
Closed on
Oct 13, 2005
Sold by
Maldonado Joaquin and Ambert Pura Colon
Bought by
Mendoza Camilo
Home Financials for this Owner
Home Financials are based on the most recent Mortgage that was taken out on this home.
Original Mortgage
$85,600
Interest Rate
7.87%
Mortgage Type
Purchase Money Mortgage
Purchase Details
Closed on
Jun 11, 2003
Sold by
Exclusa Fernando
Bought by
Menendez Joaquin Maldonado and Ambert Pura Colon
Purchase Details
Closed on
Nov 15, 2001
Sold by
Laura Robert and Clark George
Bought by
Exclusa Fernando
Purchase Details
Closed on
Aug 15, 1997
Sold by
Clark Robert and Clark Laura
Bought by
Clark Robert and Clark Laura
Home Financials for this Owner
Home Financials are based on the most recent Mortgage that was taken out on this home.
Original Mortgage
$18,150
Interest Rate
7.65%
Purchase Details
Closed on
Jul 11, 1997
Sold by
Clerveau Roland and Sadler Yolanda Marie
Bought by
Clark Robert and Clark Laura
Home Financials for this Owner
Home Financials are based on the most recent Mortgage that was taken out on this home.
Original Mortgage
$18,150
Interest Rate
7.65%
Purchase Details
Closed on
Jun 2, 1997
Sold by
Sadler Yolanda Marie
Bought by
Clark Robert and Clark Laura
Home Financials for this Owner
Home Financials are based on the most recent Mortgage that was taken out on this home.
Original Mortgage
$50,000
Interest Rate
7.98%
Purchase Details
Closed on
May 20, 1997
Sold by
Clark Robert and Clark Laura
Bought by
Sadler Yolanda
Home Financials for this Owner
Home Financials are based on the most recent Mortgage that was taken out on this home.
Original Mortgage
$50,000
Interest Rate
7.98%
Purchase Details
Closed on
Apr 8, 1996
Sold by
Clerveau Roland
Bought by
Clark Robert and Clark Laura
Purchase Details
Closed on
Dec 28, 1993
Sold by
Kip Bethel J and Jackson Bethel L
Bought by
Clerveau Roland
Create a Home Valuation Report for This Property
The Home Valuation Report is an in-depth analysis detailing your home's value as well as a comparison with similar homes in the area
Home Values in the Area
Average Home Value in this Area
Purchase History
| Date | Buyer | Sale Price | Title Company |
|---|---|---|---|
| Passarelli Giovanni Francesco | -- | Attorney | |
| Passarelli Giovanni F | $145,000 | Attorney | |
| Billingurst Llc | $71,500 | Title Guaranty Of South Flor | |
| Ferrante Nicholas | $52,000 | Attorney | |
| Wells Fargo Bank Na | $24,500 | None Available | |
| Mendoza Camilo | $107,000 | Costa Title | |
| Menendez Joaquin Maldonado | $60,000 | Universal Land Title Inc | |
| Exclusa Fernando | $33,000 | -- | |
| Clark Robert | $100 | -- | |
| Clark Robert | $100 | -- | |
| Clark Robert | $100 | -- | |
| Sadler Yolanda | $50,000 | -- | |
| Clark Robert | $30,400 | -- | |
| Clerveau Roland | $31,000 | -- |
Source: Public Records
Mortgage History
| Date | Status | Borrower | Loan Amount |
|---|---|---|---|
| Previous Owner | Mendoza Camilo | $21,400 | |
| Previous Owner | Mendoza Camilo | $85,600 | |
| Previous Owner | Clark Robert | $18,150 | |
| Previous Owner | Clark Robert | $50,000 | |
| Previous Owner | Clark Robert | $50,000 | |
| Previous Owner | Clark Robert | $50,000 |
Source: Public Records
Tax History Compared to Growth
Tax History
| Year | Tax Paid | Tax Assessment Tax Assessment Total Assessment is a certain percentage of the fair market value that is determined by local assessors to be the total taxable value of land and additions on the property. | Land | Improvement |
|---|---|---|---|---|
| 2025 | $6,279 | $252,590 | $22,520 | $230,070 |
| 2024 | $5,852 | $252,590 | $22,520 | $230,070 |
| 2023 | $5,852 | $224,140 | $0 | $0 |
| 2022 | $5,480 | $184,670 | $0 | $0 |
| 2021 | $4,689 | $167,890 | $0 | $0 |
| 2020 | $4,441 | $185,210 | $22,520 | $162,690 |
| 2019 | $4,251 | $178,950 | $22,520 | $156,430 |
| 2018 | $3,612 | $126,150 | $22,520 | $103,630 |
| 2017 | $2,543 | $72,410 | $0 | $0 |
| 2016 | $2,282 | $65,830 | $0 | $0 |
| 2015 | $2,139 | $59,850 | $0 | $0 |
| 2014 | $2,093 | $55,880 | $0 | $0 |
| 2013 | -- | $50,800 | $10,010 | $40,790 |
Source: Public Records
Map
Nearby Homes
- 5720 SW 39th St
- 5708 SW 39th St
- 5704 SW 37th St
- 5731 SW 40th Ct
- 5637 SW 40th St
- 5629 SW 40th St
- 5720 SW 40th Ct
- 5701 SW 41st St
- 5661 SW 41st St
- 20 NE 215th St
- 3700 SW 56th Ave
- 21440 N Miami Ave
- 55 NE 213th St
- 134 Miami Gardens Rd
- 105 NE 213th St
- 115 NE 213th St
- 128 Miami Gardens Rd
- 104 Clifton Rd
- 5125 SW 37th St
- 21372 NE 2nd Ct
- 5733 SW 39th St
- 5725 SW 39th St
- 5721 SW 39th St
- 5728 SW 38th St
- 5724 SW 38th St
- 3821 SW 58th Ave
- 3831 SW 58th Ave
- 5720 SW 38th St
- 5717 SW 39th St
- 5728 SW 39th St
- 5724 SW 39th St
- 5732 SW 39th St
- 3901 SW 58th Ave
- 5714 SW 38th St
- 5732 SW 38th St
- 5716 SW 39th St
- 3911 SW 58th Ave
- 5712 SW 38th St
- 5709 SW 39th St