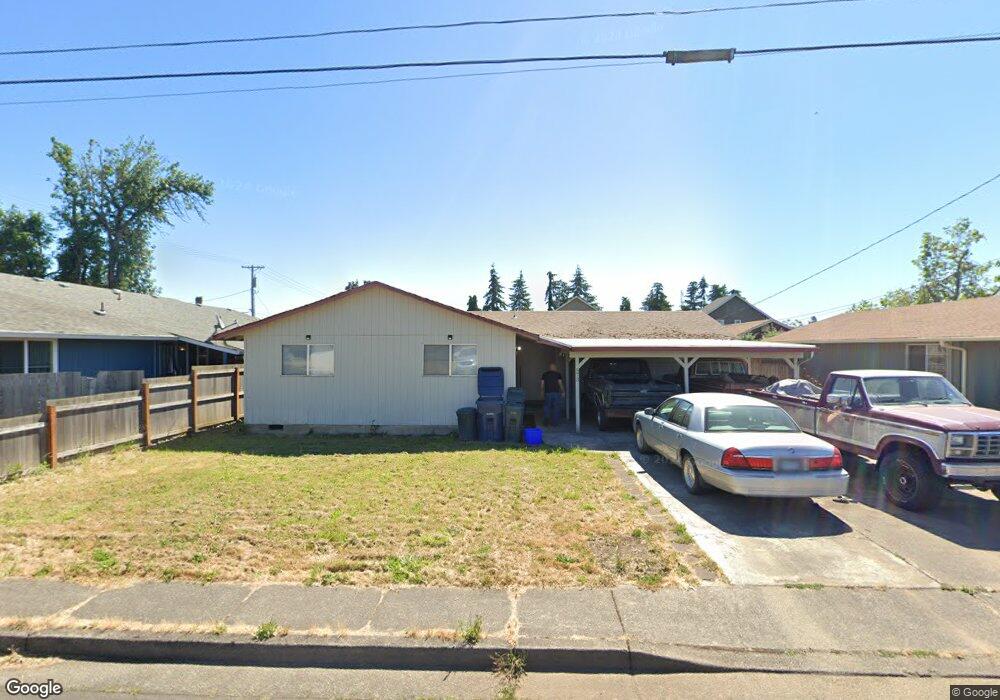
573 38th St Springfield, OR 97478
East Springfield NeighborhoodEstimated Value: $330,000 - $351,000
3
Beds
1
Bath
960
Sq Ft
$360/Sq Ft
Est. Value
About This Home
This home is located at 573 38th St, Springfield, OR 97478 and is currently estimated at $345,457, approximately $359 per square foot. 573 38th St is a home located in Lane County with nearby schools including Riverbend Elementary School, Briggs Middle School, and Thurston High School.
Ownership History
Date
Name
Owned For
Owner Type
Purchase Details
Closed on
Jul 9, 2025
Sold by
Zachow Marlon C
Bought by
Zachow Family Trust and Zachow
Current Estimated Value
Purchase Details
Closed on
Apr 22, 2011
Sold by
Offill Dennis Gayle and Offill Mary Elizabeth
Bought by
Zachow Marlon C
Home Financials for this Owner
Home Financials are based on the most recent Mortgage that was taken out on this home.
Original Mortgage
$127,500
Interest Rate
4.83%
Mortgage Type
VA
Purchase Details
Closed on
Jul 11, 2007
Sold by
Rohrich Ben
Bought by
Three Peaks Investment Inc
Create a Home Valuation Report for This Property
The Home Valuation Report is an in-depth analysis detailing your home's value as well as a comparison with similar homes in the area
Home Values in the Area
Average Home Value in this Area
Purchase History
| Date | Buyer | Sale Price | Title Company |
|---|---|---|---|
| Zachow Family Trust | -- | None Listed On Document | |
| Zachow Marlon C | $127,500 | First American Title | |
| Three Peaks Investment Inc | $135,000 | Lsi Title Company Of Oregon |
Source: Public Records
Mortgage History
| Date | Status | Borrower | Loan Amount |
|---|---|---|---|
| Previous Owner | Zachow Marlon C | $127,500 |
Source: Public Records
Tax History
| Year | Tax Paid | Tax Assessment Tax Assessment Total Assessment is a certain percentage of the fair market value that is determined by local assessors to be the total taxable value of land and additions on the property. | Land | Improvement |
|---|---|---|---|---|
| 2025 | $2,923 | $159,420 | -- | -- |
| 2024 | $2,876 | $154,777 | -- | -- |
| 2023 | $2,876 | $150,269 | -- | -- |
| 2022 | $2,664 | $145,893 | $0 | $0 |
| 2021 | $2,616 | $141,644 | $0 | $0 |
| 2020 | $2,540 | $137,519 | $0 | $0 |
| 2019 | $2,463 | $133,514 | $0 | $0 |
| 2018 | $2,322 | $125,850 | $0 | $0 |
| 2017 | $2,233 | $125,850 | $0 | $0 |
| 2016 | $2,186 | $122,184 | $0 | $0 |
| 2015 | $2,123 | $118,625 | $0 | $0 |
| 2014 | $2,091 | $115,170 | $0 | $0 |
Source: Public Records
Map
Nearby Homes
Your Personal Tour Guide
Ask me questions while you tour the home.