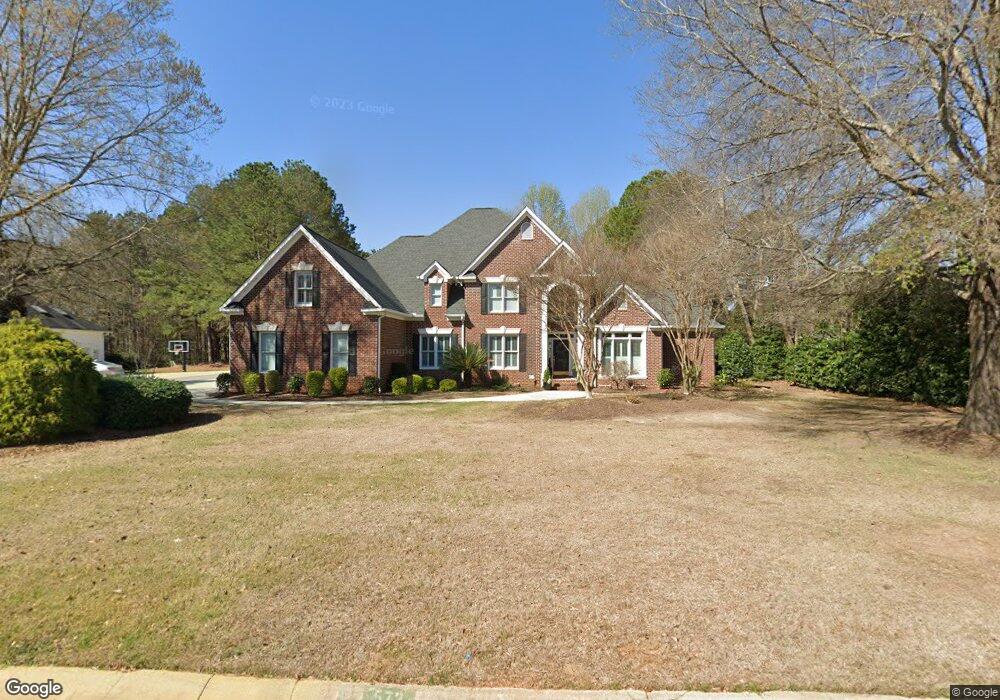
573 Charles Ct Lexington, SC 29072
Estimated Value: $849,000 - $936,509
4
Beds
5
Baths
4,626
Sq Ft
$193/Sq Ft
Est. Value
About This Home
This home is located at 573 Charles Ct, Lexington, SC 29072 and is currently estimated at $893,627, approximately $193 per square foot. 573 Charles Ct is a home located in Lexington County with nearby schools including Midway Elementary School, River Bluff High School, and Lake Murray Montessori School.
Ownership History
Date
Name
Owned For
Owner Type
Purchase Details
Closed on
Feb 28, 2018
Sold by
Hicks Robert D and Hicks Julie T
Bought by
Clampitt Kyle M and Clampitt Kathryn S
Current Estimated Value
Home Financials for this Owner
Home Financials are based on the most recent Mortgage that was taken out on this home.
Original Mortgage
$453,100
Outstanding Balance
$385,092
Interest Rate
4.04%
Mortgage Type
New Conventional
Estimated Equity
$508,535
Purchase Details
Closed on
Nov 15, 2012
Sold by
Davis Scott K and Davis Beth G
Bought by
Hicks Robert D and Hicks Julie T
Home Financials for this Owner
Home Financials are based on the most recent Mortgage that was taken out on this home.
Original Mortgage
$417,000
Interest Rate
3.4%
Mortgage Type
Future Advance Clause Open End Mortgage
Purchase Details
Closed on
Oct 25, 2004
Sold by
Davis Scott K
Bought by
Davis Scott K and Davis Beth G
Create a Home Valuation Report for This Property
The Home Valuation Report is an in-depth analysis detailing your home's value as well as a comparison with similar homes in the area
Home Values in the Area
Average Home Value in this Area
Purchase History
| Date | Buyer | Sale Price | Title Company |
|---|---|---|---|
| Clampitt Kyle M | $580,000 | None Available | |
| Hicks Robert D | $480,000 | -- | |
| Davis Scott K | -- | -- |
Source: Public Records
Mortgage History
| Date | Status | Borrower | Loan Amount |
|---|---|---|---|
| Open | Clampitt Kyle M | $453,100 | |
| Previous Owner | Hicks Robert D | $417,000 |
Source: Public Records
Tax History Compared to Growth
Tax History
| Year | Tax Paid | Tax Assessment Tax Assessment Total Assessment is a certain percentage of the fair market value that is determined by local assessors to be the total taxable value of land and additions on the property. | Land | Improvement |
|---|---|---|---|---|
| 2024 | $3,676 | $24,620 | $4,000 | $20,620 |
| 2023 | $3,676 | $24,620 | $4,000 | $20,620 |
| 2020 | $3,760 | $24,620 | $4,000 | $20,620 |
| 2019 | $3,607 | $23,200 | $4,000 | $19,200 |
| 2018 | $2,939 | $19,262 | $4,000 | $15,262 |
| 2017 | $2,851 | $19,262 | $4,000 | $15,262 |
| 2016 | $2,825 | $19,261 | $4,000 | $15,261 |
| 2014 | $2,556 | $18,220 | $4,000 | $14,220 |
| 2013 | -- | $26,130 | $4,800 | $21,330 |
Source: Public Records
Map
Nearby Homes
- 568 Charles Ct
- 143 Holly Leaf Ln
- 305 Saddlebrooke Rd
- 247 Saxons Ferry Dr
- 533 Midway Forest Trail
- 516 Midway Forest Trail
- 105 Winyah Ct
- 140 Leonard Dr
- 261 Popes Ln
- 122 Lupine Ct
- TBD Baron Rd
- 113 Silverstone Rd
- 105 Garden Trail Ln
- 2472 Mineral Springs Rd
- 518 Saddlebrooke Ln
- 240 Misty Oaks Ct
- 131 Giaben Dr
- 310 Andrew Corley Rd
- 306 Andrew Corley Rd
- 109 Armanda Rd
- 565 Charles Ct
- 581 Charles Ct
- 572 Charles Ct
- 533 Corley Manor Ct
- 561 Charles Ct
- 564 Charles Ct
- 576 Charles Ct
- 539 Corley Manor Ct
- 527 Corley Manor Ct
- 585 Charles Ct
- 580 Charles Ct
- 521 Corley Manor Ct
- 540 Corley Manor Ct
- 589 Charles Ct
- 560 Charles Ct
- 534 Corley Manor Ct
- 528 Corley Manor Ct
- 584 Charles Ct
- 513 Corley Manor Ct
- 522 Corley Manor Ct