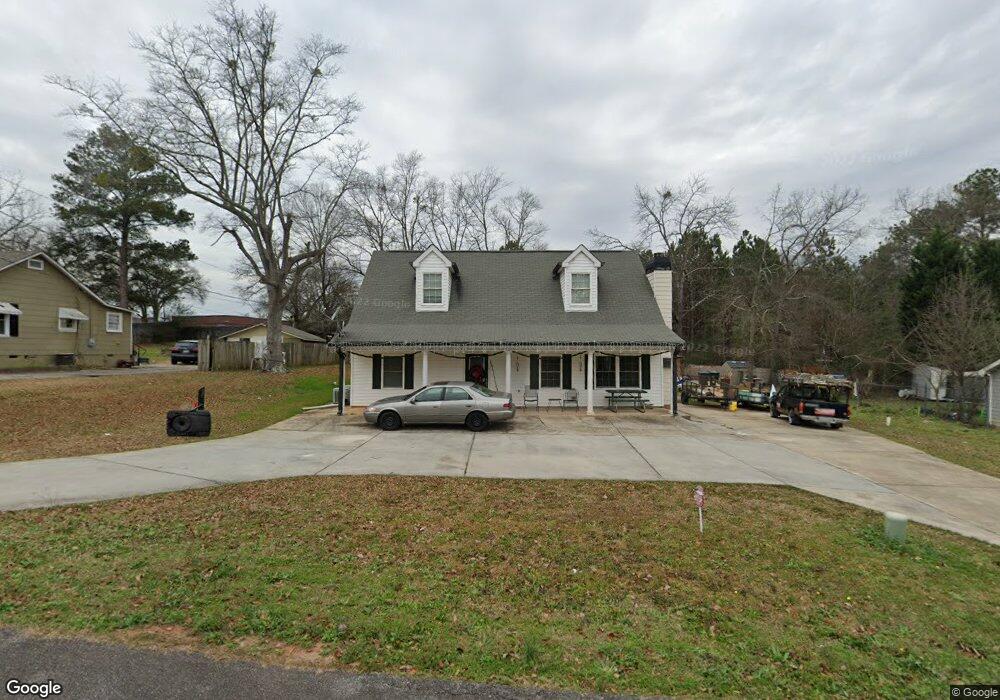
573 Davidson Dr Norcross, GA 30071
Estimated Value: $457,000 - $495,948
3
Beds
3
Baths
2,182
Sq Ft
$215/Sq Ft
Est. Value
About This Home
This home is located at 573 Davidson Dr, Norcross, GA 30071 and is currently estimated at $469,987, approximately $215 per square foot. 573 Davidson Dr is a home located in Gwinnett County with nearby schools including Norcross Elementary School, Summerour Middle School, and Norcross High School.
Ownership History
Date
Name
Owned For
Owner Type
Purchase Details
Closed on
Jul 8, 2022
Sold by
Alfonso Jesus
Bought by
Jym Investment Grp
Current Estimated Value
Purchase Details
Closed on
Oct 2, 2017
Sold by
Alfonso Jesus
Bought by
Alfonso Jesus and Celayandia Maria Magdalena Car
Purchase Details
Closed on
Oct 1, 2013
Sold by
City Of Norcross
Bought by
Williams Ronald
Purchase Details
Closed on
Apr 18, 2005
Sold by
Guthrie David M
Bought by
Alfonso Jesus
Home Financials for this Owner
Home Financials are based on the most recent Mortgage that was taken out on this home.
Original Mortgage
$125,520
Interest Rate
6.59%
Mortgage Type
New Conventional
Purchase Details
Closed on
Apr 17, 2005
Sold by
Jack Stein Ira
Bought by
Guthrie David M
Home Financials for this Owner
Home Financials are based on the most recent Mortgage that was taken out on this home.
Original Mortgage
$125,520
Interest Rate
6.59%
Mortgage Type
New Conventional
Purchase Details
Closed on
May 26, 2004
Sold by
Regions Bk
Bought by
Brown Steven
Create a Home Valuation Report for This Property
The Home Valuation Report is an in-depth analysis detailing your home's value as well as a comparison with similar homes in the area
Home Values in the Area
Average Home Value in this Area
Purchase History
| Date | Buyer | Sale Price | Title Company |
|---|---|---|---|
| Jym Investment Grp | -- | -- | |
| Alfonso Jesus | -- | -- | |
| Williams Ronald | -- | -- | |
| Alfonso Jesus | $156,900 | -- | |
| Guthrie David M | -- | -- | |
| Brown Steven | -- | -- |
Source: Public Records
Mortgage History
| Date | Status | Borrower | Loan Amount |
|---|---|---|---|
| Previous Owner | Alfonso Jesus | $125,520 | |
| Previous Owner | Alfonso Jesus | $31,380 | |
| Previous Owner | Guthrie David M | $21,000 |
Source: Public Records
Tax History Compared to Growth
Tax History
| Year | Tax Paid | Tax Assessment Tax Assessment Total Assessment is a certain percentage of the fair market value that is determined by local assessors to be the total taxable value of land and additions on the property. | Land | Improvement |
|---|---|---|---|---|
| 2025 | $4,687 | $215,280 | $25,840 | $189,440 |
| 2024 | $4,143 | $181,040 | $50,000 | $131,040 |
| 2023 | $4,143 | $167,320 | $37,600 | $129,720 |
| 2022 | $3,093 | $129,360 | $34,000 | $95,360 |
| 2021 | $1,427 | $49,320 | $16,000 | $33,320 |
| 2020 | $1,440 | $49,320 | $16,000 | $33,320 |
| 2019 | $1,942 | $49,320 | $16,000 | $33,320 |
| 2018 | $1,443 | $49,320 | $16,000 | $33,320 |
| 2016 | $758 | $28,560 | $8,000 | $20,560 |
| 2015 | $1,084 | $28,560 | $8,000 | $20,560 |
| 2014 | $772 | $28,560 | $8,000 | $20,560 |
Source: Public Records
Map
Nearby Homes
- 622 Summer Place
- 608 Summer Place
- 5639 Chatham Cir
- 63 Born St NW
- 5596 Buford Hwy
- 53 Born St
- 2468 Whistle Stop Dr
- 53AND63 Born St
- 2472 Westhill Ct
- 2472 Westhill Ct NW
- 435 Webb Dr
- 746 Oak Terrace
- 5358 Beaver Branch
- 5357 Beaver Branch
- 5364 Hickory Knoll
- 2918 Wild Laurel Ct
- 2848 Wild Laurel Ct
- 5257 Westhill Dr
- 204 Wingo St
- 5167 Conductor Ct
- 581 Davidson Dr
- 547 Davidson Dr
- 527 Davidson Dr
- 552 Davidson Dr
- 586 Davidson Dr
- 518 Davidson Dr
- 513 Davidson Dr
- 597 Davidson Dr
- 496 Davidson Dr
- 604 Davidson Dr
- 0 Davidson Dr NW Unit 3246221
- 5412 Giles St
- 5410 Giles St
- 5388 Light Dr
- 5430 Buford Hwy
- 606 Davidson Dr
- 2590 Beaver Ruin Rd
- 5440 Buford Hwy
- 5377 Light Dr
- 2580 Beaver Ruin Rd