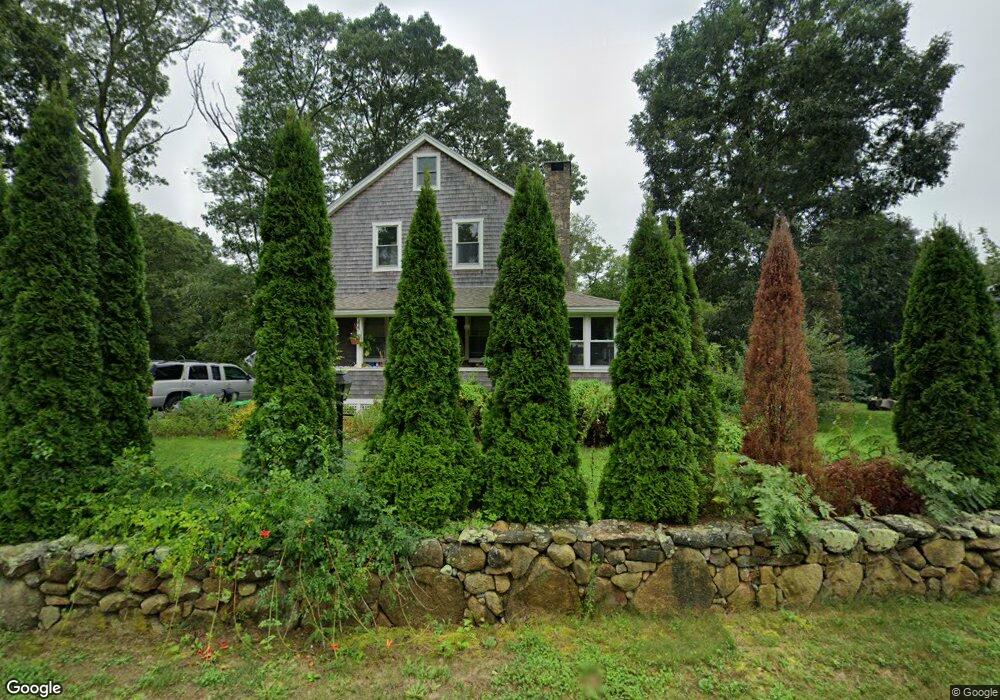
573 Gifford Rd Westport, MA 02790
Head of Westport NeighborhoodEstimated Value: $426,000 - $601,000
2
Beds
1
Bath
808
Sq Ft
$668/Sq Ft
Est. Value
About This Home
This home is located at 573 Gifford Rd, Westport, MA 02790 and is currently estimated at $539,524, approximately $667 per square foot. 573 Gifford Rd is a home located in Bristol County with nearby schools including Alice A. Macomber Primary School, Westport Elementary School, and Westport Middle-High School.
Ownership History
Date
Name
Owned For
Owner Type
Purchase Details
Closed on
Sep 15, 2004
Sold by
Tripp Dawn Fay and Perry June Alma
Bought by
Corrao Jonathan N
Current Estimated Value
Home Financials for this Owner
Home Financials are based on the most recent Mortgage that was taken out on this home.
Original Mortgage
$204,250
Interest Rate
6.02%
Mortgage Type
Purchase Money Mortgage
Create a Home Valuation Report for This Property
The Home Valuation Report is an in-depth analysis detailing your home's value as well as a comparison with similar homes in the area
Home Values in the Area
Average Home Value in this Area
Purchase History
| Date | Buyer | Sale Price | Title Company |
|---|---|---|---|
| Corrao Jonathan N | $215,000 | -- |
Source: Public Records
Mortgage History
| Date | Status | Borrower | Loan Amount |
|---|---|---|---|
| Open | Corrao Jonathan N | $204,000 | |
| Closed | Corrao Jonathan N | $204,250 |
Source: Public Records
Tax History Compared to Growth
Tax History
| Year | Tax Paid | Tax Assessment Tax Assessment Total Assessment is a certain percentage of the fair market value that is determined by local assessors to be the total taxable value of land and additions on the property. | Land | Improvement |
|---|---|---|---|---|
| 2025 | $3,918 | $525,900 | $171,700 | $354,200 |
| 2024 | $3,864 | $499,900 | $152,400 | $347,500 |
| 2023 | $3,814 | $467,400 | $138,800 | $328,600 |
| 2022 | $3,674 | $433,200 | $138,800 | $294,400 |
| 2021 | $3,526 | $409,100 | $114,700 | $294,400 |
| 2020 | $3,005 | $356,500 | $110,200 | $246,300 |
| 2019 | $2,701 | $326,600 | $110,200 | $216,400 |
| 2018 | $3,742 | $301,300 | $111,100 | $190,200 |
| 2017 | $2,328 | $292,100 | $107,600 | $184,500 |
| 2016 | $2,282 | $288,500 | $104,000 | $184,500 |
| 2015 | $2,097 | $264,500 | $106,400 | $158,100 |
Source: Public Records
Map
Nearby Homes
- 561 Gifford Rd
- 579 Gifford Rd
- 574 Gifford Rd
- 585 Gifford Rd
- 560 Gifford Rd
- 553 Gifford Rd
- 589 Gifford Rd
- 935 American Legion Hwy
- 595 Gifford Rd
- 2 Miracle Ln
- 588 Gifford Rd
- 945 American Legion Hwy
- 601 Gifford Rd
- 955 American Legion Hwy
- 940 American Legion Hwy
- 6 Miracle Ln
- 607 Gifford Rd
- 930 American Legion Hwy Unit 930G
- 930 American Legion Hwy Unit 930F
- 930 American Legion Hwy Unit 930W