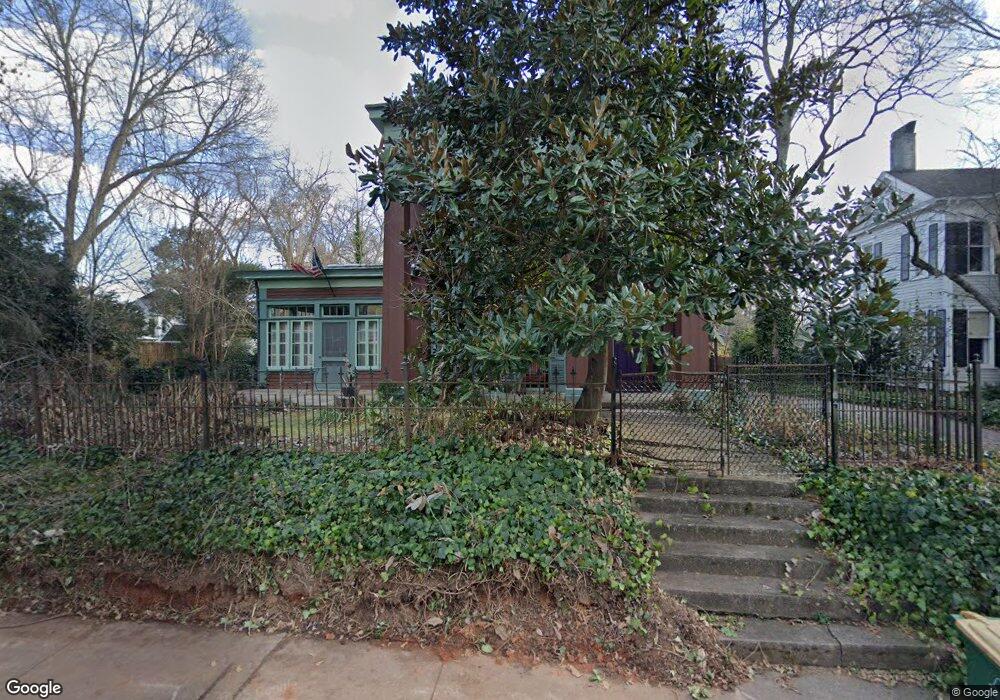
573 Hill St Athens, GA 30606
Cobbham NeighborhoodEstimated Value: $887,000 - $1,128,000
--
Bed
2
Baths
3,356
Sq Ft
$308/Sq Ft
Est. Value
About This Home
This home is located at 573 Hill St, Athens, GA 30606 and is currently estimated at $1,034,421, approximately $308 per square foot. 573 Hill St is a home located in Clarke County with nearby schools including Johnnie Lay Burks Elementary School, Clarke Middle School, and Clarke Central High School.
Ownership History
Date
Name
Owned For
Owner Type
Purchase Details
Closed on
Jun 17, 2013
Sold by
Cassady Scott H
Bought by
Cassady Scott H
Current Estimated Value
Purchase Details
Closed on
May 20, 2003
Sold by
Ramsey Bonnie and Henry Elrod Ra
Bought by
Cassady Scott H and Jane Tyson Cassad
Purchase Details
Closed on
Mar 27, 2002
Sold by
Ramsey Bonnie
Bought by
Ramsey Bonnie and Henry Elrod Ramsey
Purchase Details
Closed on
Mar 12, 2002
Sold by
Ramsey Bonnie Uter and Henry Elr
Bought by
Ramsey Bonnie
Purchase Details
Closed on
Feb 26, 2001
Sold by
Ramsey Bonnie Uter
Bought by
Ramsey Bonnie Uter and Henry Elrod Ra
Purchase Details
Closed on
Feb 15, 2001
Sold by
Ramsey Bonnie Uter and Henry Elr
Bought by
Ramsey Bonnie Uter
Purchase Details
Closed on
Jun 7, 1996
Sold by
Ramsey Bonnie Uter
Bought by
Ramsey Bonnie Uter and Henry Elrod Ra
Purchase Details
Closed on
Apr 12, 1995
Sold by
Berry William T and Berry Mari L
Bought by
Uter Bonnie N and Henry Elrod Ramsey
Create a Home Valuation Report for This Property
The Home Valuation Report is an in-depth analysis detailing your home's value as well as a comparison with similar homes in the area
Home Values in the Area
Average Home Value in this Area
Purchase History
| Date | Buyer | Sale Price | Title Company |
|---|---|---|---|
| Cassady Scott H | -- | -- | |
| Cassady Scott H | $464,500 | -- | |
| Ramsey Bonnie | -- | -- | |
| Ramsey Bonnie | -- | -- | |
| Ramsey Bonnie Uter | -- | -- | |
| Ramsey Bonnie Uter | -- | -- | |
| Ramsey Bonnie Uter | -- | -- | |
| Uter Bonnie N | $250,000 | -- |
Source: Public Records
Tax History Compared to Growth
Tax History
| Year | Tax Paid | Tax Assessment Tax Assessment Total Assessment is a certain percentage of the fair market value that is determined by local assessors to be the total taxable value of land and additions on the property. | Land | Improvement |
|---|---|---|---|---|
| 2025 | $7,380 | $369,992 | $57,132 | $312,860 |
| 2024 | $7,380 | $351,646 | $57,132 | $294,514 |
| 2023 | $7,446 | $299,523 | $57,132 | $242,391 |
| 2022 | $6,565 | $253,235 | $57,132 | $196,103 |
| 2021 | $6,513 | $223,040 | $57,132 | $165,908 |
| 2020 | $6,332 | $209,813 | $57,132 | $152,681 |
| 2019 | $6,266 | $201,486 | $57,132 | $144,354 |
| 2018 | $6,102 | $189,729 | $57,132 | $132,597 |
| 2017 | $5,886 | $183,360 | $57,132 | $126,228 |
| 2016 | $6,065 | $188,645 | $57,132 | $131,513 |
| 2015 | $6,018 | $186,995 | $63,480 | $123,515 |
| 2014 | $6,027 | $186,996 | $63,480 | $123,516 |
Source: Public Records
Map
Nearby Homes
- 468 N Milledge Ave Unit 203
- 480 N Billups St
- 552 Cobb St
- 1196 W Hancock Ave Unit 1
- 1198 W West Hancock Ave W
- 257 Hill St
- 570 Prince Ave
- 1226 W Broad St
- 500 Dearing St Unit 6
- 597 Dearing St
- 1398 W Hancock Ave
- 283 King Ave
- 100 Prince Ave Unit A404
- 100 Prince Ave Unit A407
- 195 Beulah Ave
- 559 Pulaski St
- 365 S Church St Unit 1A, 1B, 1C
- 143 Barrow St
- 290 Hodgson Dr
- 145 Hendrix Ave
- 595 Hill St
- 390 Franklin St
- 455 N Milledge Ave
- 455 Milledge Heights
- 619 Hill St
- 760 Meigs St
- 0 Franklin St Unit 3241151
- 0 Hill St Unit 7241710
- 0 Hill St Unit 7079646
- 0 Hill St Unit 3144316
- 0 Hill St Unit 8684413
- 0 Hill St Unit 8684698
- 0 Hill St Unit 7016953
- 0 Franklin St
- 445 N Milledge Ave
- 594 Hill St
- 387 Franklin St
- 560 Hill St
- 629 Hill St
- 425 N Milledge Ave