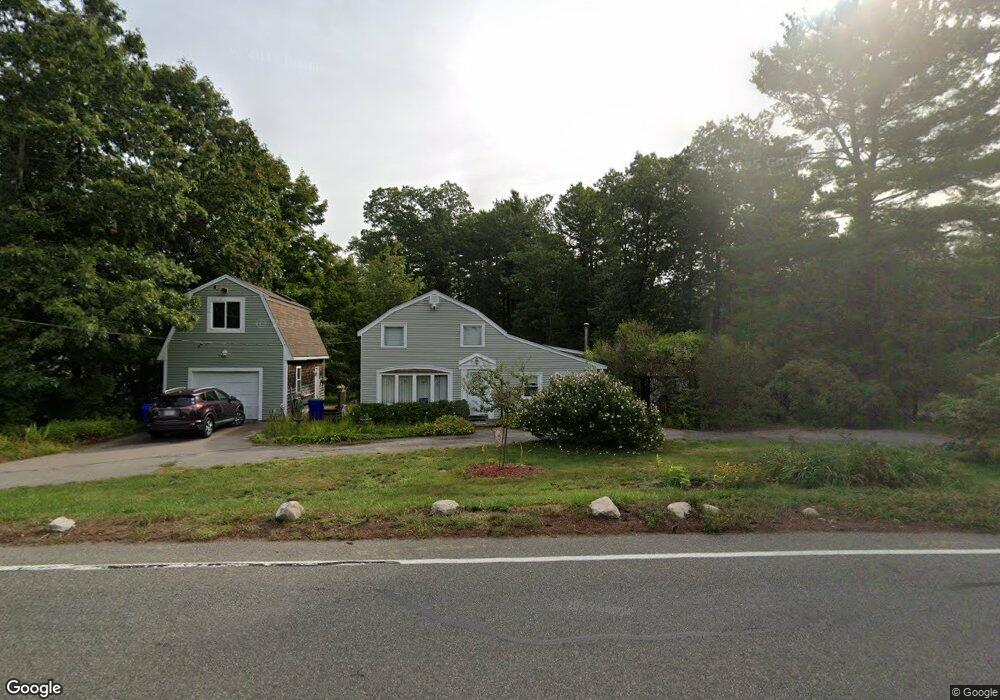
573 Hingham St Rockland, MA 02370
Estimated Value: $481,000 - $544,000
Studio
2
Baths
1,128
Sq Ft
$445/Sq Ft
Est. Value
About This Home
This home is located at 573 Hingham St, Rockland, MA 02370 and is currently estimated at $502,489, approximately $445 per square foot. 573 Hingham St is a home located in Plymouth County with nearby schools including Rockland Senior High School, Calvary Chapel Academy, and Holy Family Elementary School.
Ownership History
Date
Name
Owned For
Owner Type
Purchase Details
Closed on
Dec 15, 1987
Sold by
Kenny Edward S
Bought by
Bernazzani Thomas R
Current Estimated Value
Home Financials for this Owner
Home Financials are based on the most recent Mortgage that was taken out on this home.
Original Mortgage
$119,200
Interest Rate
10.96%
Mortgage Type
Purchase Money Mortgage
Create a Home Valuation Report for This Property
The Home Valuation Report is an in-depth analysis detailing your home's value as well as a comparison with similar homes in the area
Home Values in the Area
Average Home Value in this Area
Purchase History
| Date | Buyer | Sale Price | Title Company |
|---|---|---|---|
| Bernazzani Thomas R | $125,500 | -- |
Source: Public Records
Mortgage History
| Date | Status | Borrower | Loan Amount |
|---|---|---|---|
| Open | Bernazzani Thomas R | $112,000 | |
| Closed | Bernazzani Thomas R | $119,200 |
Source: Public Records
Tax History
| Year | Tax Paid | Tax Assessment Tax Assessment Total Assessment is a certain percentage of the fair market value that is determined by local assessors to be the total taxable value of land and additions on the property. | Land | Improvement |
|---|---|---|---|---|
| 2025 | $5,710 | $417,700 | $232,800 | $184,900 |
| 2024 | $5,545 | $394,400 | $219,600 | $174,800 |
| 2023 | $5,356 | $351,900 | $190,900 | $161,000 |
| 2022 | $5,139 | $306,800 | $166,000 | $140,800 |
| 2021 | $4,750 | $274,900 | $150,900 | $124,000 |
| 2020 | $4,594 | $262,500 | $143,800 | $118,700 |
| 2019 | $4,491 | $250,600 | $136,900 | $113,700 |
| 2018 | $4,291 | $235,500 | $136,900 | $98,600 |
| 2017 | $4,208 | $227,700 | $136,900 | $90,800 |
| 2016 | $4,055 | $219,300 | $131,700 | $87,600 |
| 2015 | $3,998 | $210,100 | $123,100 | $87,000 |
| 2014 | $3,784 | $206,300 | $120,700 | $85,600 |
Source: Public Records
Map
Nearby Homes
- 14 Pleasant View Park
- 206-208 Hinghm St
- 7 Boxberry Ln Unit 7
- 55 Turner Rd
- 6 Nelson Rd
- 18 Colby St
- 8 Blueberry Ct
- 5 Blueberry Ct
- 21 Liberty Ct
- 737-739 Union St
- 40 Summit St
- 35-37 Salem St
- 55 Oregon Ave
- 436 E Water St
- 48 Bigelow Ave
- 98 Myrtle St
- 18 Winterberry Ln
- 14 Dyer St Unit 14
- 12 Dyer St Unit 12
- 19 Dyer St Unit 19
- 568 Hingham St
- 559 Hingham St
- 591 Hingham St
- 586 Hingham St
- 565 Hingham St
- 556 Hingham St
- 553 Hingham St
- 620 Hingham St
- 548 Hingham St
- 537 Hingham St
- 615 Hingham St
- 536 Hingham St
- 614 Hingham St
- 612 Hingham St
- 610 Hingham St
- 608 Hingham St
- 616 Hingham St
- 524 Hingham St Unit 524
- 522 Hingham St Unit 524
- 631 Hingham St
Your Personal Tour Guide
Ask me questions while you tour the home.