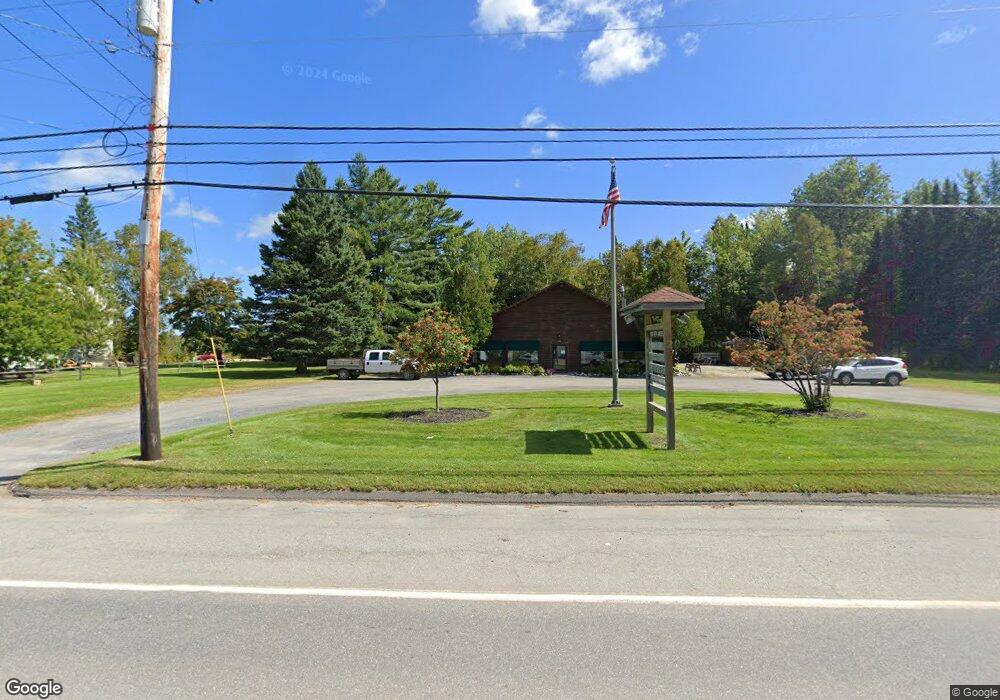
573 Main St Jackman, ME 04945
Estimated Value: $248,000
Studio
--
Bath
--
Sq Ft
1.4
Acres
About This Home
This home is located at 573 Main St, Jackman, ME 04945 and is currently estimated at $248,000. 573 Main St is a home with nearby schools including Forest Hills Consolidated School.
Ownership History
Date
Name
Owned For
Owner Type
Purchase Details
Closed on
Dec 2, 2020
Sold by
Northern Woods Logging
Bought by
Stpeter Micheael P
Current Estimated Value
Home Financials for this Owner
Home Financials are based on the most recent Mortgage that was taken out on this home.
Original Mortgage
$50,000
Outstanding Balance
$44,309
Interest Rate
2.7%
Mortgage Type
New Conventional
Estimated Equity
$203,691
Create a Home Valuation Report for This Property
The Home Valuation Report is an in-depth analysis detailing your home's value as well as a comparison with similar homes in the area
Purchase History
| Date | Buyer | Sale Price | Title Company |
|---|---|---|---|
| Stpeter Micheael P | -- | None Available | |
| Stpeter Micheael P | -- | None Available | |
| Stpeter Micheael P | -- | None Available |
Source: Public Records
Mortgage History
| Date | Status | Borrower | Loan Amount |
|---|---|---|---|
| Open | Stpeter Micheael P | $50,000 | |
| Closed | Stpeter Micheael P | $50,000 |
Source: Public Records
Tax History
| Year | Tax Paid | Tax Assessment Tax Assessment Total Assessment is a certain percentage of the fair market value that is determined by local assessors to be the total taxable value of land and additions on the property. | Land | Improvement |
|---|---|---|---|---|
| 2024 | $3,103 | $137,300 | $42,300 | $95,000 |
| 2023 | $3,014 | $137,300 | $42,300 | $95,000 |
| 2022 | $2,655 | $137,300 | $42,300 | $95,000 |
| 2021 | $2,655 | $137,300 | $42,300 | $95,000 |
| 2020 | $2,595 | $137,300 | $42,300 | $95,000 |
| 2019 | $2,595 | $137,300 | $42,300 | $95,000 |
| 2018 | $2,666 | $137,300 | $42,300 | $95,000 |
| 2017 | $2,677 | $137,300 | $42,300 | $95,000 |
| 2016 | $2,540 | $137,300 | $42,300 | $95,000 |
| 2015 | $2,250 | $137,300 | $42,300 | $95,000 |
| 2014 | $2,197 | $137,300 | $42,300 | $95,000 |
| 2013 | $2,169 | $137,300 | $42,300 | $95,000 |
Source: Public Records
Map
Nearby Homes
- 579 Main St
- 594 Main St
- 5 Heald Stream Rd
- 15 Lake St
- 7 Forest St
- MAP SO035
- 36 Deer Run Dr
- 290 Long Pond Rd
- 757 Long Pond Rd
- 2991 U S 201
- S0015 Pushard Ln
- 1261 Dirigo Rd
- TBD Paradise Ln
- 133 Paradise Ln
- 143 Paradise Ln
- M10L24-2N U S 201
- M10L24-2S U S 201
- 1 Partridge Rd
- Lot 16 Bear Track Ln
- 774 Troutdale Rd
Your Personal Tour Guide
Ask me questions while you tour the home.