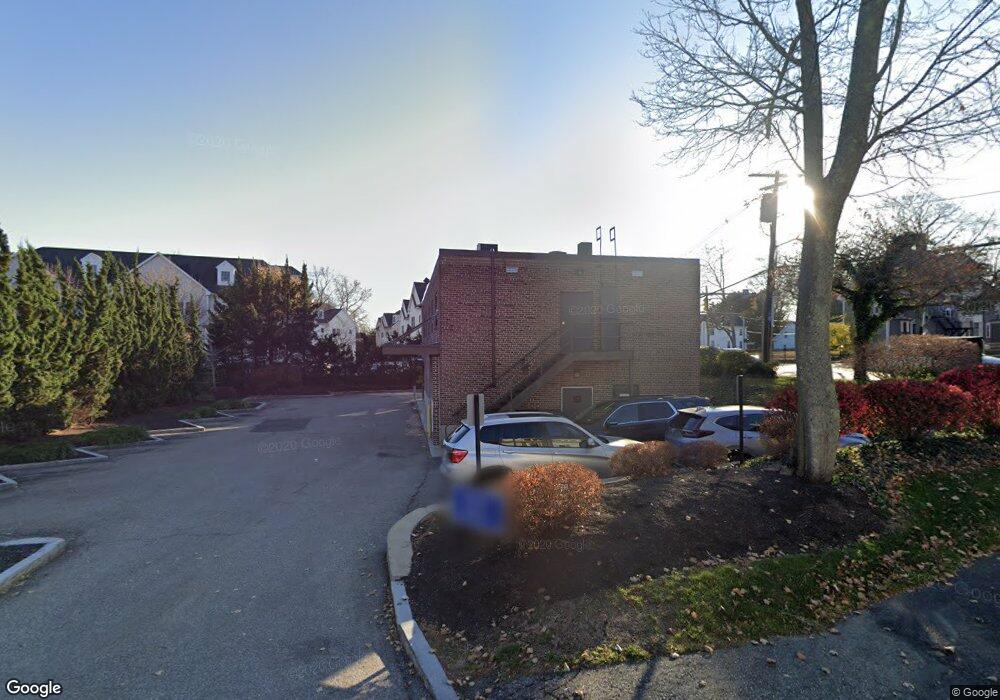
573 Main St Woburn, MA 01801
Downtown Woburn NeighborhoodEstimated Value: $1,472,150
10
Beds
3
Baths
3,782
Sq Ft
$389/Sq Ft
Est. Value
About This Home
This home is located at 573 Main St, Woburn, MA 01801 and is currently estimated at $1,472,150, approximately $389 per square foot. 573 Main St is a home located in Middlesex County with nearby schools including Malcolm White Elementary School, John F. Kennedy Middle School, and Woburn High School.
Ownership History
Date
Name
Owned For
Owner Type
Purchase Details
Closed on
Dec 21, 2023
Sold by
573 Main Street Rt and Heller
Bought by
Lexx Companies Llc
Current Estimated Value
Home Financials for this Owner
Home Financials are based on the most recent Mortgage that was taken out on this home.
Original Mortgage
$969,375
Outstanding Balance
$951,639
Interest Rate
7.5%
Mortgage Type
Purchase Money Mortgage
Estimated Equity
$520,511
Purchase Details
Closed on
Jul 20, 2000
Sold by
Restivo Prop Rt and Restivo
Bought by
573 Main St Rt and Walker
Purchase Details
Closed on
Mar 21, 1997
Sold by
Mainmanning Rt and Veno
Bought by
Restivo Prop Rt and Restivo
Home Financials for this Owner
Home Financials are based on the most recent Mortgage that was taken out on this home.
Original Mortgage
$175,000
Interest Rate
7.68%
Mortgage Type
Commercial
Create a Home Valuation Report for This Property
The Home Valuation Report is an in-depth analysis detailing your home's value as well as a comparison with similar homes in the area
Home Values in the Area
Average Home Value in this Area
Purchase History
| Date | Buyer | Sale Price | Title Company |
|---|---|---|---|
| Lexx Companies Llc | $1,292,500 | None Available | |
| 573 Main St Rt | $420,000 | -- | |
| Restivo Prop Rt | $350,000 | -- | |
| Restivo Prop Rt | $350,000 | -- |
Source: Public Records
Mortgage History
| Date | Status | Borrower | Loan Amount |
|---|---|---|---|
| Open | Lexx Companies Llc | $969,375 | |
| Previous Owner | Restivo Prop Rt | $175,000 | |
| Previous Owner | Restivo Prop Rt | $82,000 |
Source: Public Records
Tax History Compared to Growth
Tax History
| Year | Tax Paid | Tax Assessment Tax Assessment Total Assessment is a certain percentage of the fair market value that is determined by local assessors to be the total taxable value of land and additions on the property. | Land | Improvement |
|---|---|---|---|---|
| 2025 | $21,780 | $1,067,100 | $224,000 | $843,100 |
| 2024 | $13,662 | $692,800 | $224,000 | $468,800 |
| 2023 | $14,646 | $692,800 | $224,000 | $468,800 |
| 2022 | $14,372 | $631,200 | $224,000 | $407,200 |
| 2021 | $14,429 | $631,200 | $224,000 | $407,200 |
| 2020 | $14,644 | $631,200 | $224,000 | $407,200 |
| 2019 | $10,921 | $614,600 | $224,000 | $390,600 |
| 2018 | $14,905 | $597,400 | $156,800 | $440,600 |
| 2017 | $14,805 | $592,900 | $156,800 | $436,100 |
| 2016 | $14,164 | $549,200 | $156,800 | $392,400 |
| 2015 | $14,139 | $537,600 | $154,400 | $383,200 |
| 2014 | $13,990 | $510,400 | $154,400 | $356,000 |
Source: Public Records
Map
Nearby Homes
- 577 Main St
- 577 Main St Unit 1
- 1 Kilby St Unit 3-5
- 5 Manning St
- 3 Manning St Unit 2
- 3 Manning St
- 555 Main St Unit 18
- 555 Main St Unit 17
- 555 Main St Unit 15
- 555 Main St Unit 14
- 555 Main St Unit 13
- 555 Main St Unit 12
- 555 Main St Unit 11
- 555 Main St Unit 10
- 555 Main St Unit 9
- 555 Main St Unit 8
- 555 Main St Unit 7
- 555 Main St Unit 6
- 555 Main St Unit 5
- 555 Main St Unit 3