573 Market St Lithopolis, OH 43136
Bloom NeighborhoodEstimated Value: $244,554 - $256,000
About This Home
This home is located at 573 Market St, Lithopolis, OH 43136 and is currently estimated at $250,139, approximately $228 per square foot. 573 Market St is a home located in Fairfield County with nearby schools including Bloom Carroll Intermediate School, Bloom Carroll Primary School, and Bloom-Carroll Middle School.
Ownership History
We collect this data history from publicly available records. To have your information removed, we recommend requesting removal directly through your county’s website.
Purchase Details
Home Financials for this Owner
Home Financials are based on the most recent Mortgage that was taken out on this home.Home Values in the Area
Average Home Value in this Area
Purchase History
We collect this data history from publicly available records. To have your information removed, we recommend requesting removal directly through your county’s website.
| Date | Buyer | Sale Price | Title Company |
|---|---|---|---|
| $104,800 | Hummel Title Agency |
Mortgage History
We collect this data history from publicly available records. To have your information removed, we recommend requesting removal directly through your county’s website.
| Date | Status | Borrower | Loan Amount |
|---|---|---|---|
| Previous Owner | $99,200 |
Tax History
We collect this data history from publicly available records. To have your information removed, we recommend requesting removal directly through your county’s website.
| Year | Tax Paid | Tax Assessment Tax Assessment Total Assessment is a certain percentage of the fair market value that is determined by local assessors to be the total taxable value of land and additions on the property. | Land | Improvement |
|---|---|---|---|---|
| 2025 | $4,614 | $73,640 | $21,000 | $52,640 |
| 2024 | $4,614 | $58,110 | $8,750 | $49,360 |
| 2023 | $2,007 | $58,110 | $8,750 | $49,360 |
| 2022 | $2,040 | $58,110 | $8,750 | $49,360 |
| 2021 | $1,663 | $45,310 | $8,750 | $36,560 |
| 2020 | $1,681 | $45,310 | $8,750 | $36,560 |
| 2019 | $1,686 | $45,310 | $8,750 | $36,560 |
| 2018 | $1,371 | $39,050 | $8,750 | $30,300 |
| 2017 | $1,288 | $39,050 | $8,750 | $30,300 |
| 2016 | $1,268 | $39,050 | $8,750 | $30,300 |
| 2015 | $1,244 | $37,700 | $8,750 | $28,950 |
| 2014 | $1,201 | $37,700 | $8,750 | $28,950 |
| 2013 | $1,201 | $37,700 | $8,750 | $28,950 |
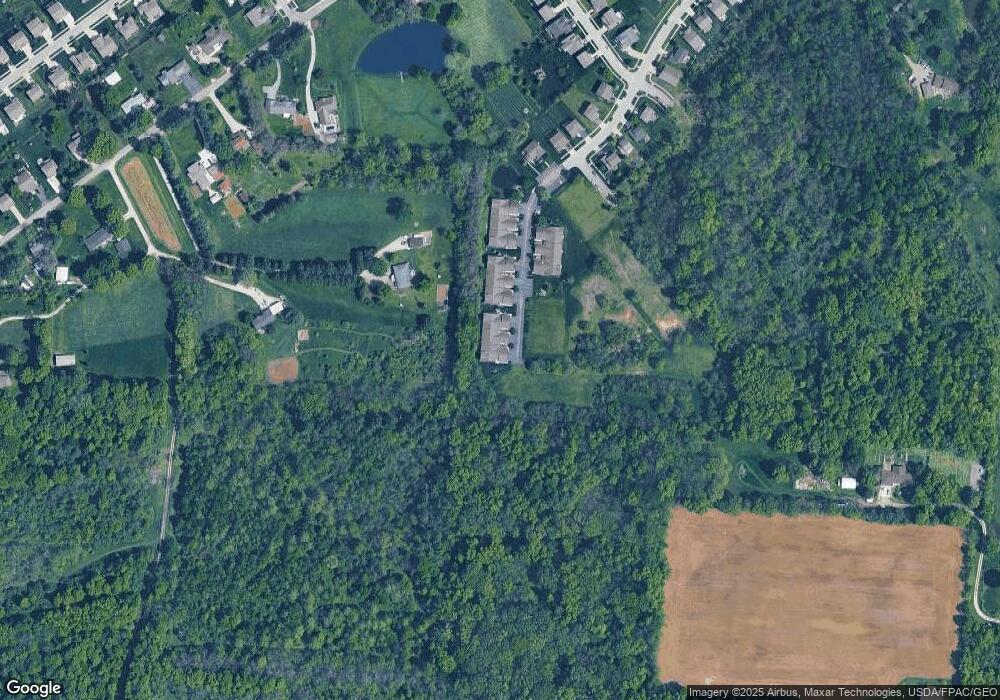
Map
- 539 S Market St
- 0 Sycamore Bluff Way
- 40 W Twin Maple Ave
- 631 Rolling Acre Dr
- 565 Rolling Acre Dr
- 123 E South St
- 110 S Walnut St
- 133 E South St
- 502 Rolling Acre Dr
- 86 S Delaware
- 178 E South St
- 88 North St
- 3721 Cedar Hill Rd NW
- 400 Westview Terrace
- 468 Faulkner Dr
- 3450 Winchester Southern Rd
- 10603 Lithopolis Rd NW
- 1510 Hansberry Dr
- 433 Sandburg Dr
- 515 Hemingway Ave
- 577 Market St Unit 577
- 569 Market St Unit 569
- 565 Market St
- 561 Market St Unit 561
- 577 S Market St
- 557 Market St Unit 557
- 543 Market St Unit 543
- 547 Market St Unit 547
- 547 S Market St
- 539 Market St Unit 539
- 535 Market St Unit 535
- 527 Market St Unit 527
- 530 Market St Unit 530
- 517 Market St Unit 517
- 522 Market St
- 513 Market St Unit 513
- 11665 Smith Rd
- 518 Market St Unit 518
- 509 Market St Unit 509
- 514 Market St
Ask me questions while you tour the home.