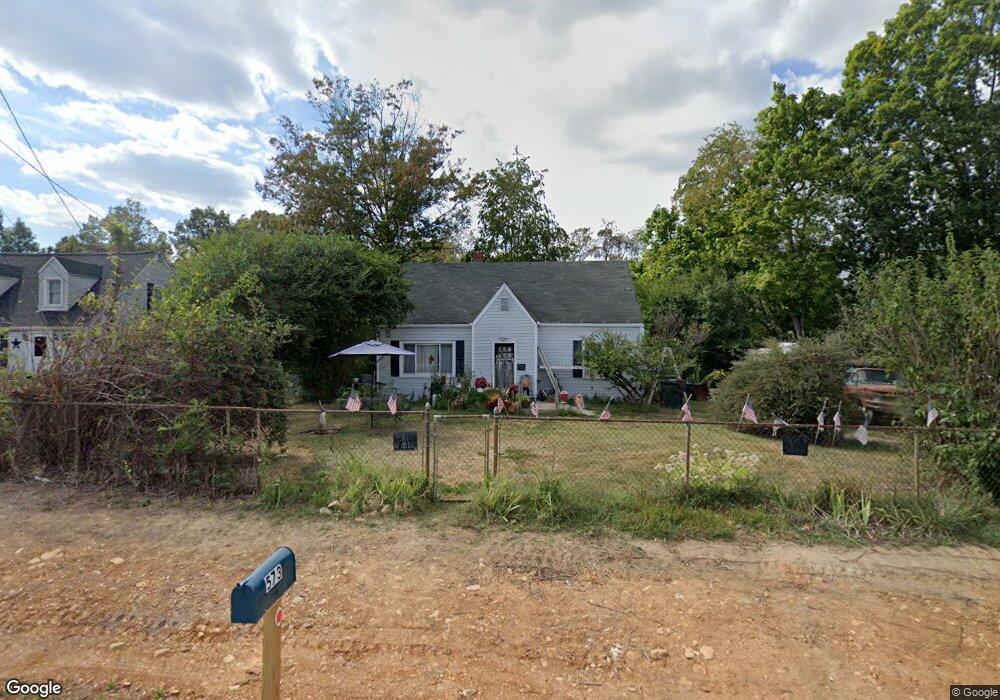
573 Mt Torrey Rd Lyndhurst, VA 22952
Estimated Value: $228,000 - $321,000
4
Beds
1
Bath
2,117
Sq Ft
$124/Sq Ft
Est. Value
About This Home
This home is located at 573 Mt Torrey Rd, Lyndhurst, VA 22952 and is currently estimated at $263,177, approximately $124 per square foot. 573 Mt Torrey Rd is a home located in Augusta County with nearby schools including Stuarts Draft Elementary School, Stuarts Draft Middle School, and Stuarts Draft High School.
Ownership History
Date
Name
Owned For
Owner Type
Purchase Details
Closed on
Apr 28, 2023
Sold by
Nicely Wallace C and Nicely Donna M
Bought by
Wallace C Nicely And Donna M Nicely Family Re and Nicely
Current Estimated Value
Purchase Details
Closed on
Apr 26, 2023
Sold by
Nicely Wallace C
Bought by
Nicely Wallace C and Nicely Donna M
Create a Home Valuation Report for This Property
The Home Valuation Report is an in-depth analysis detailing your home's value as well as a comparison with similar homes in the area
Purchase History
| Date | Buyer | Sale Price | Title Company |
|---|---|---|---|
| Wallace C Nicely And Donna M Nicely Family Re | -- | None Listed On Document | |
| Nicely Wallace C | -- | None Listed On Document |
Source: Public Records
Tax History
| Year | Tax Paid | Tax Assessment Tax Assessment Total Assessment is a certain percentage of the fair market value that is determined by local assessors to be the total taxable value of land and additions on the property. | Land | Improvement |
|---|---|---|---|---|
| 2025 | $654 | $125,700 | $60,000 | $65,700 |
| 2024 | $660 | $127,000 | $60,000 | $67,000 |
| 2023 | $641 | $101,700 | $50,000 | $51,700 |
| 2022 | $641 | $101,700 | $50,000 | $51,700 |
| 2021 | $641 | $101,700 | $50,000 | $51,700 |
| 2020 | $641 | $101,700 | $50,000 | $51,700 |
| 2019 | $641 | $101,700 | $50,000 | $51,700 |
| 2018 | $614 | $97,441 | $50,000 | $47,441 |
| 2017 | $565 | $97,441 | $50,000 | $47,441 |
| 2016 | $565 | $97,441 | $50,000 | $47,441 |
| 2015 | $500 | $97,441 | $50,000 | $47,441 |
| 2014 | $500 | $97,441 | $50,000 | $47,441 |
| 2013 | $500 | $104,100 | $55,000 | $49,100 |
Source: Public Records
Map
Nearby Homes
- 20 Shadow Ln
- 00 Mt Torrey Rd
- 2591 Lyndhurst Rd
- 0 Mount Torrey Rd
- 001 Mount Torrey Rd
- 389 Shalom Rd
- 2495 E Lyndhurst Rd
- 1059 Mt Torrey Rd
- 00 Lyndhurst Rd
- 18 Providence Ln
- 1416 Ladd Rd
- 514 Lipscomb Rd
- 2024 Baylor Ave
- 19 Mathews Ln
- 1325 Mt Torrey Rd
- 96 Shalom Rd
- 00 Lipscomb Rd
- 200 Shenandoah Village Dr
- 257 Camden Coyner Ln
- 248 Camden Coyner Ln
- 565 Mt Torrey Rd
- 579 Mt Torrey Rd
- 555 Mt Torrey Rd
- 587 Mt Torrey Rd
- 587 Mount Torrey Rd
- 570 Mt Torrey Rd
- 2984 Lyndhurst Rd
- 582 Mt Torrey Rd
- 2996 Lyndhurst Rd
- 597 Mt Torrey Rd
- 562 Mt Torrey Rd
- 3002 Lyndhurst Rd
- 547 Mt Torrey Rd
- 590 Mt Torrey Rd
- 554 Mt Torrey Rd
- 3010 Lyndhurst Rd
- 601 Mt Torrey Rd
- 596 Mt Torrey Rd
- 2976 Lyndhurst Rd
- 6 Nursery Rd
Your Personal Tour Guide
Ask me questions while you tour the home.