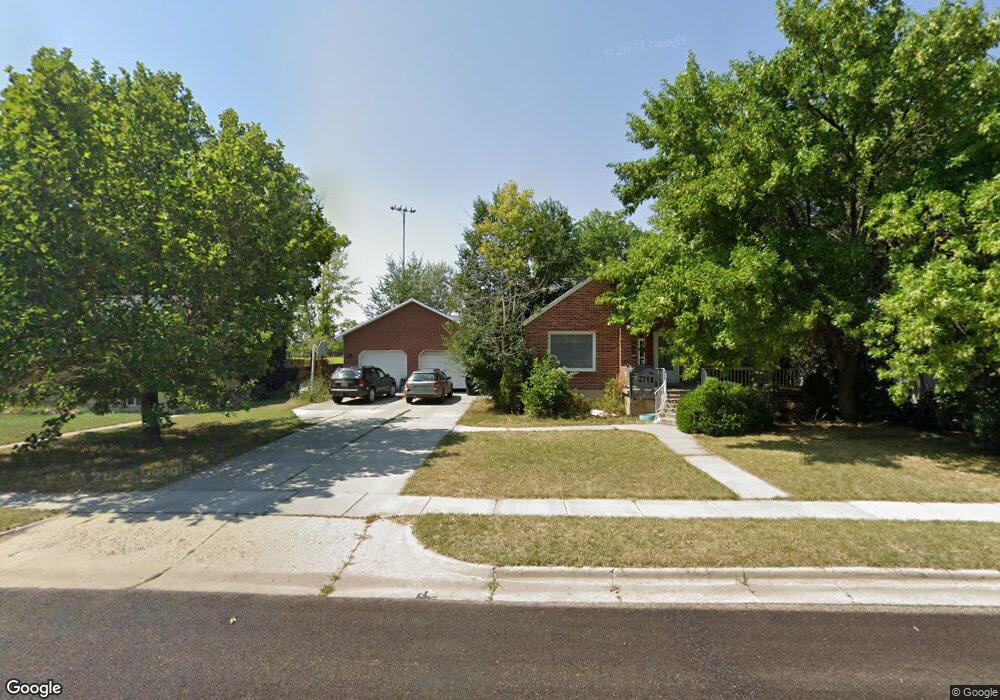
573 N Tremont St Tremonton, UT 84337
Estimated Value: $404,000 - $493,000
--
Bed
--
Bath
1,524
Sq Ft
$284/Sq Ft
Est. Value
About This Home
This home is located at 573 N Tremont St, Tremonton, UT 84337 and is currently estimated at $433,358, approximately $284 per square foot. 573 N Tremont St is a home located in Box Elder County with nearby schools including North Park School, Alice C. Harris Intermediate School, and Bear River Middle School.
Ownership History
Date
Name
Owned For
Owner Type
Purchase Details
Closed on
Sep 15, 2006
Sold by
Brough Curtis W and Brough Nancy
Bought by
Richardson Troy and Richardson Jennifer
Current Estimated Value
Home Financials for this Owner
Home Financials are based on the most recent Mortgage that was taken out on this home.
Original Mortgage
$166,155
Outstanding Balance
$99,183
Interest Rate
6.56%
Mortgage Type
FHA
Estimated Equity
$334,175
Create a Home Valuation Report for This Property
The Home Valuation Report is an in-depth analysis detailing your home's value as well as a comparison with similar homes in the area
Home Values in the Area
Average Home Value in this Area
Purchase History
| Date | Buyer | Sale Price | Title Company |
|---|---|---|---|
| Richardson Troy | -- | Phillips Hansen Land Title C |
Source: Public Records
Mortgage History
| Date | Status | Borrower | Loan Amount |
|---|---|---|---|
| Open | Richardson Troy | $166,155 |
Source: Public Records
Tax History Compared to Growth
Tax History
| Year | Tax Paid | Tax Assessment Tax Assessment Total Assessment is a certain percentage of the fair market value that is determined by local assessors to be the total taxable value of land and additions on the property. | Land | Improvement |
|---|---|---|---|---|
| 2025 | $2,597 | $436,368 | $105,000 | $331,368 |
| 2024 | $2,597 | $440,445 | $105,000 | $335,445 |
| 2023 | $2,728 | $454,389 | $100,000 | $354,389 |
| 2022 | $2,336 | $221,826 | $16,500 | $205,326 |
| 2021 | $2,046 | $259,936 | $30,000 | $229,936 |
| 2020 | $1,719 | $259,936 | $30,000 | $229,936 |
| 2019 | $1,591 | $128,416 | $16,500 | $111,916 |
| 2018 | $1,141 | $85,577 | $13,750 | $71,827 |
| 2017 | $1,197 | $155,595 | $13,750 | $130,595 |
| 2016 | $1,176 | $82,157 | $13,750 | $68,407 |
| 2015 | $1,067 | $75,938 | $13,750 | $62,188 |
| 2014 | $1,067 | $72,977 | $13,750 | $59,227 |
| 2013 | -- | $72,977 | $13,338 | $59,639 |
Source: Public Records
Map
Nearby Homes
- 3 W 600 N
- 524 N 100 E
- 225 E 600 N
- 155 E 300 N
- 789 N 100 W
- 720 N 300 E
- 476 W 450 N
- 221 E 800 N
- 137 N 870 E
- 780 N 350 E
- 696 N 600 W Unit 105
- 688 N 600 W Unit 104
- 678 600 W
- 688 600 W
- 696 600 W
- 702 600 W
- 758 N 400 E
- 691 W 600 N
- Glendale Plan at Envision Estates - Tremonton
- Hawthorne Plan at Envision Estates - Tremonton