573 Newberry Ln Unit Bldg-Unit Howell, MI 48843
Estimated Value: $305,390 - $337,000
2
Beds
2
Baths
1,571
Sq Ft
$205/Sq Ft
Est. Value
About This Home
This home is located at 573 Newberry Ln Unit Bldg-Unit, Howell, MI 48843 and is currently estimated at $322,098, approximately $205 per square foot. 573 Newberry Ln Unit Bldg-Unit is a home located in Livingston County with nearby schools including Parker Middle School, Howell High School, and St Joseph Catholic School.
Ownership History
Date
Name
Owned For
Owner Type
Purchase Details
Closed on
Feb 22, 2024
Sold by
Spaw Wilma G
Bought by
Garsia L Spaw And Wilma G Spaw Revocable Trus and Spaw
Current Estimated Value
Purchase Details
Closed on
Feb 16, 2024
Sold by
Spaw Wilma G
Bought by
Garsia L Spaw And Wilma G Spaw Revocable Trus and Spaw
Purchase Details
Closed on
May 17, 2018
Sold by
Shaw 3Rd Charles H and Shaw Sharon A
Bought by
Spaw Wilma G
Home Financials for this Owner
Home Financials are based on the most recent Mortgage that was taken out on this home.
Original Mortgage
$64,000
Interest Rate
4.4%
Mortgage Type
New Conventional
Purchase Details
Closed on
Mar 19, 2013
Sold by
Shaw Charles H and Shaw Sharon A
Bought by
Shaw Charles H and Shaw Sharon A
Purchase Details
Closed on
Jun 17, 2011
Sold by
Shaw Charles H and Shaw Sharon A
Bought by
Shaw Charles H and Shaw Sharon A
Purchase Details
Closed on
May 17, 2002
Sold by
Adler Enterprises Company Llc
Bought by
Eagle Land Development Company and Adler Building & Development Company
Purchase Details
Closed on
May 10, 2002
Sold by
The Eagle Land Development Company
Bought by
Shaw Charles H and Shaw Sharon Ann
Create a Home Valuation Report for This Property
The Home Valuation Report is an in-depth analysis detailing your home's value as well as a comparison with similar homes in the area
Home Values in the Area
Average Home Value in this Area
Purchase History
| Date | Buyer | Sale Price | Title Company |
|---|---|---|---|
| Garsia L Spaw And Wilma G Spaw Revocable Trus | -- | None Listed On Document | |
| Garsia L Spaw And Wilma G Spaw Revocable Trus | -- | None Listed On Document | |
| Spaw Wilma G | $200,000 | -- | |
| Shaw Charles H | -- | -- | |
| Shaw Charles H | -- | -- | |
| Eagle Land Development Company | -- | -- | |
| Shaw Charles H | $163,990 | -- | |
| Eagle Land Development Company | -- | -- |
Source: Public Records
Mortgage History
| Date | Status | Borrower | Loan Amount |
|---|---|---|---|
| Previous Owner | Spaw Wilma G | $64,000 |
Source: Public Records
Tax History Compared to Growth
Tax History
| Year | Tax Paid | Tax Assessment Tax Assessment Total Assessment is a certain percentage of the fair market value that is determined by local assessors to be the total taxable value of land and additions on the property. | Land | Improvement |
|---|---|---|---|---|
| 2025 | $1,635 | $134,500 | $0 | $0 |
| 2024 | $1,588 | $125,600 | $0 | $0 |
| 2023 | $1,517 | $111,900 | $0 | $0 |
| 2022 | $2,063 | $94,300 | $0 | $0 |
| 2021 | $2,015 | $94,300 | $0 | $0 |
| 2020 | $2,050 | $98,800 | $0 | $0 |
| 2019 | $2,022 | $88,400 | $0 | $0 |
| 2018 | $1,574 | $89,800 | $0 | $0 |
| 2017 | $1,552 | $86,700 | $0 | $0 |
| 2016 | $1,546 | $77,300 | $0 | $0 |
| 2014 | $1,421 | $64,800 | $0 | $0 |
| 2012 | $1,421 | $67,900 | $0 | $0 |
Source: Public Records
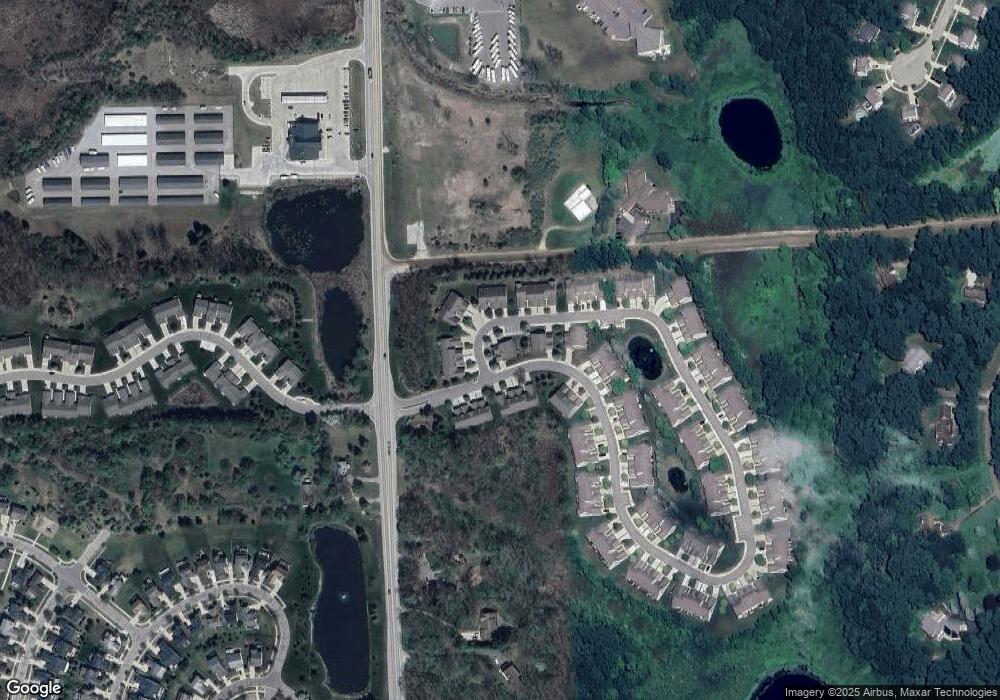
Map
Nearby Homes
- 88 Champlain Blvd
- 1200 Portsmouth Dr
- 1025 Camellia Cir Unit 41
- 1031 Camellia Cir Unit 40
- 210 Canyon Creek Ct Unit 2
- 1034 Camellia Cir Unit 46
- 1012 Camellia Cir Unit 48
- 1044 Camellia Cir Unit 45
- 1054 Camellia Cir Unit 44
- 457 Hosta
- 480 Hosta
- 2058 Dabate Dr
- 1071 Tracilee Dr
- Lot 3 of Lockes St
- 232 Marion Oaks Dr
- 1189 Lockes St
- 1177 Lockes St
- 1201 Lockes St
- Elements 2700 Plan at Tamarack Place
- Integrity 2060 Plan at Tamarack Place
- 573 Newberry Ln Unit 83
- 579 Newberry Ln Unit 84
- 73 Newberry Ln Unit 85
- 505 Newberry Ln Unit 86
- 505 W Newberry Dr W Unit 86
- 572 Newberry Ln
- 524 Newberry Ln Unit 10
- 530 Newberry Ln Unit 9
- 60 Newberry Ln
- 536 Newberry Ln Unit 8
- 560 Newberry Ln Unit 4
- 566 Newberry Ln Unit 3
- 580 Newberry Ln Unit 1
- 54 Newberry Ln Unit 77
- 66 Newberry Ln
- 48 Newberry Ln Unit 78
- 518 Newberry Ln Unit 11
- 512 Newberry Ln Unit 12
- 554 Newberry Ln Unit 5
- 548 Newberry Ln Unit 6