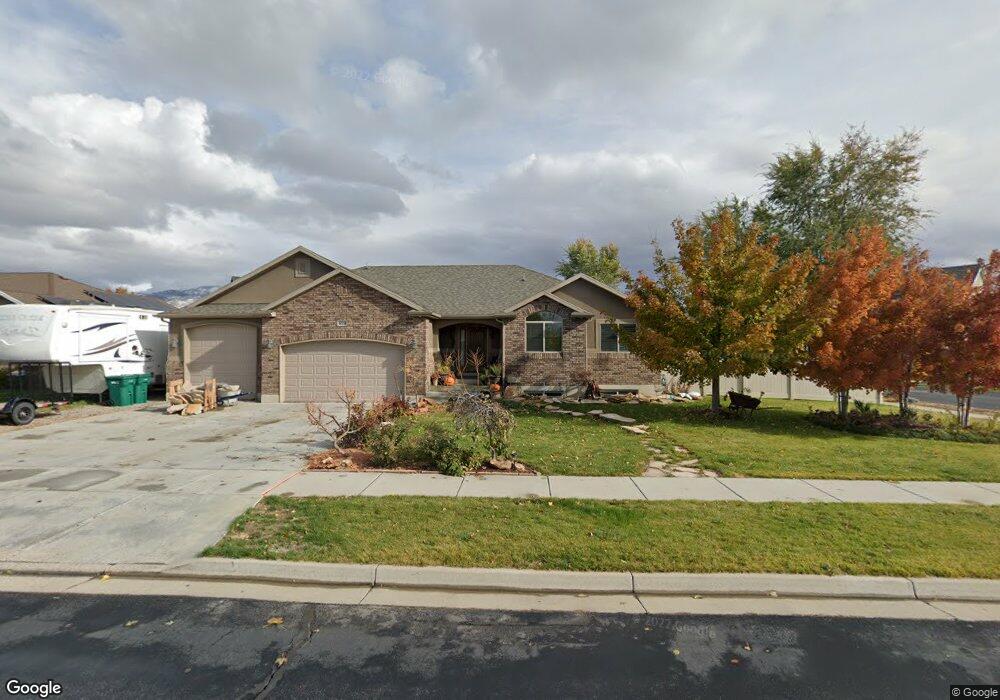
573 S 850 W Layton, UT 84041
Estimated Value: $570,000 - $664,000
2
Beds
3
Baths
1,591
Sq Ft
$391/Sq Ft
Est. Value
About This Home
This home is located at 573 S 850 W, Layton, UT 84041 and is currently estimated at $621,516, approximately $390 per square foot. 573 S 850 W is a home with nearby schools including Heritage Elementary School, Shoreline Junior High School, and Layton High School.
Ownership History
Date
Name
Owned For
Owner Type
Purchase Details
Closed on
Jan 10, 2022
Sold by
Stevenson David
Bought by
Blood Shannon
Current Estimated Value
Home Financials for this Owner
Home Financials are based on the most recent Mortgage that was taken out on this home.
Original Mortgage
$380,975
Outstanding Balance
$350,444
Interest Rate
3.12%
Mortgage Type
New Conventional
Estimated Equity
$271,072
Purchase Details
Closed on
Nov 9, 2020
Sold by
Blood Kevin B and Blood Shannon
Bought by
Stevenson David
Purchase Details
Closed on
Feb 26, 2013
Sold by
Castle Creek Homes Llc
Bought by
Blood Kevin B and Blood Shannon
Home Financials for this Owner
Home Financials are based on the most recent Mortgage that was taken out on this home.
Original Mortgage
$273,303
Interest Rate
3.25%
Mortgage Type
FHA
Purchase Details
Closed on
Aug 21, 2012
Sold by
Nsc West Properties Llc
Bought by
Blood Kevin B and Blood Shannon
Home Financials for this Owner
Home Financials are based on the most recent Mortgage that was taken out on this home.
Original Mortgage
$212,710
Interest Rate
3.53%
Mortgage Type
Construction
Create a Home Valuation Report for This Property
The Home Valuation Report is an in-depth analysis detailing your home's value as well as a comparison with similar homes in the area
Home Values in the Area
Average Home Value in this Area
Purchase History
| Date | Buyer | Sale Price | Title Company |
|---|---|---|---|
| Blood Shannon | -- | First American Title | |
| Stevenson David | -- | Stewart Title Inc | |
| Blood Kevin B | -- | Mountain View Title | |
| Blood Kevin B | -- | Mountain View Title & |
Source: Public Records
Mortgage History
| Date | Status | Borrower | Loan Amount |
|---|---|---|---|
| Open | Blood Shannon | $380,975 | |
| Previous Owner | Blood Kevin B | $273,303 | |
| Previous Owner | Blood Kevin B | $212,710 |
Source: Public Records
Tax History
| Year | Tax Paid | Tax Assessment Tax Assessment Total Assessment is a certain percentage of the fair market value that is determined by local assessors to be the total taxable value of land and additions on the property. | Land | Improvement |
|---|---|---|---|---|
| 2025 | $3,034 | $318,451 | $124,548 | $193,903 |
| 2024 | $2,913 | $308,000 | $133,516 | $174,484 |
| 2023 | $2,811 | $524,000 | $140,773 | $383,227 |
| 2022 | $3,190 | $587,000 | $149,473 | $437,527 |
| 2021 | $3,054 | $461,000 | $123,299 | $337,701 |
| 2020 | $2,755 | $399,000 | $105,271 | $293,729 |
| 2019 | $2,707 | $384,000 | $104,263 | $279,737 |
| 2018 | $2,472 | $352,000 | $91,857 | $260,143 |
| 2016 | $2,350 | $172,645 | $38,016 | $134,629 |
| 2015 | $2,211 | $154,165 | $38,016 | $116,149 |
| 2014 | $2,480 | $176,806 | $38,016 | $138,790 |
| 2013 | -- | $88,001 | $42,396 | $45,605 |
Source: Public Records
Map
Nearby Homes
Your Personal Tour Guide
Ask me questions while you tour the home.