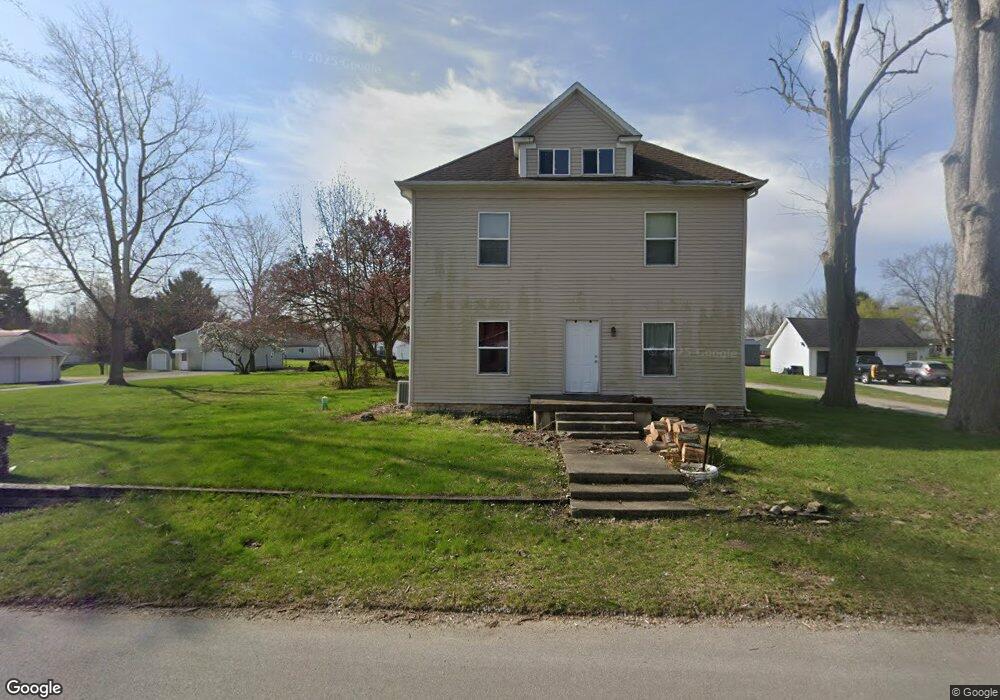
573 Sivey St Wabash, IN 46992
Estimated Value: $163,000 - $226,379
4
Beds
3
Baths
3,290
Sq Ft
$60/Sq Ft
Est. Value
About This Home
This home is located at 573 Sivey St, Wabash, IN 46992 and is currently estimated at $196,595, approximately $59 per square foot. 573 Sivey St is a home located in Wabash County with nearby schools including O.J. Neighbours Elementary School, W C Mills Elementary School, and Wabash Middle School.
Ownership History
Date
Name
Owned For
Owner Type
Purchase Details
Closed on
Apr 5, 2022
Sold by
Miller Dewayne E and Lynn Lori
Bought by
King Teresa
Current Estimated Value
Purchase Details
Closed on
Nov 15, 2012
Sold by
Miller Dewayne E
Bought by
Miller Dewayne E and Miller Lori Lynn
Purchase Details
Closed on
Sep 21, 2009
Sold by
The Bank Of New York Mellson Trust Co
Bought by
Miller Dewayne E
Purchase Details
Closed on
May 19, 2009
Sold by
Gmac Margage Llc
Bought by
The Bank Of New York Mellon Trust Compan
Create a Home Valuation Report for This Property
The Home Valuation Report is an in-depth analysis detailing your home's value as well as a comparison with similar homes in the area
Home Values in the Area
Average Home Value in this Area
Purchase History
| Date | Buyer | Sale Price | Title Company |
|---|---|---|---|
| King Teresa | $50,000 | None Listed On Document | |
| Miller Dewayne E | -- | None Available | |
| Miller Dewayne E | -- | -- | |
| Miller Dewayne E | -- | None Available | |
| The Bank Of New York Mellon Trust Compan | $36,544 | -- |
Source: Public Records
Tax History Compared to Growth
Tax History
| Year | Tax Paid | Tax Assessment Tax Assessment Total Assessment is a certain percentage of the fair market value that is determined by local assessors to be the total taxable value of land and additions on the property. | Land | Improvement |
|---|---|---|---|---|
| 2024 | $1,239 | $122,900 | $25,200 | $97,700 |
| 2023 | $1,266 | $121,600 | $25,200 | $96,400 |
| 2022 | $1,135 | $108,700 | $21,600 | $87,100 |
| 2021 | $1,956 | $100,000 | $21,600 | $78,400 |
| 2020 | $2,008 | $102,600 | $21,600 | $81,000 |
| 2019 | $1,682 | $86,300 | $21,600 | $64,700 |
| 2018 | $1,686 | $83,200 | $21,600 | $61,600 |
| 2017 | $1,633 | $79,400 | $21,600 | $57,800 |
| 2016 | $2,120 | $107,300 | $21,600 | $85,700 |
| 2014 | $1,879 | $97,900 | $21,600 | $76,300 |
| 2013 | $1,871 | $92,900 | $21,600 | $71,300 |
Source: Public Records
Map
Nearby Homes
- 665 Linlawn Dr
- 1569 Vernon St
- 1472 Middle St
- 1430 Vernon St
- 173 Shady Lane Dr
- 1558 Webster St
- 2792 S River Rd
- 516 W Hill St
- 27 N Comstock St
- 765 Lafontaine Ave
- 125 N Comstock St
- 492 W Maple St
- 196 E Main St
- 35 E Sinclair St
- 244 N Miami St
- 472 Vermont St
- 153 Ferry St
- 495 Stitt St
- 387 N Wabash St
- 459 E Hill St