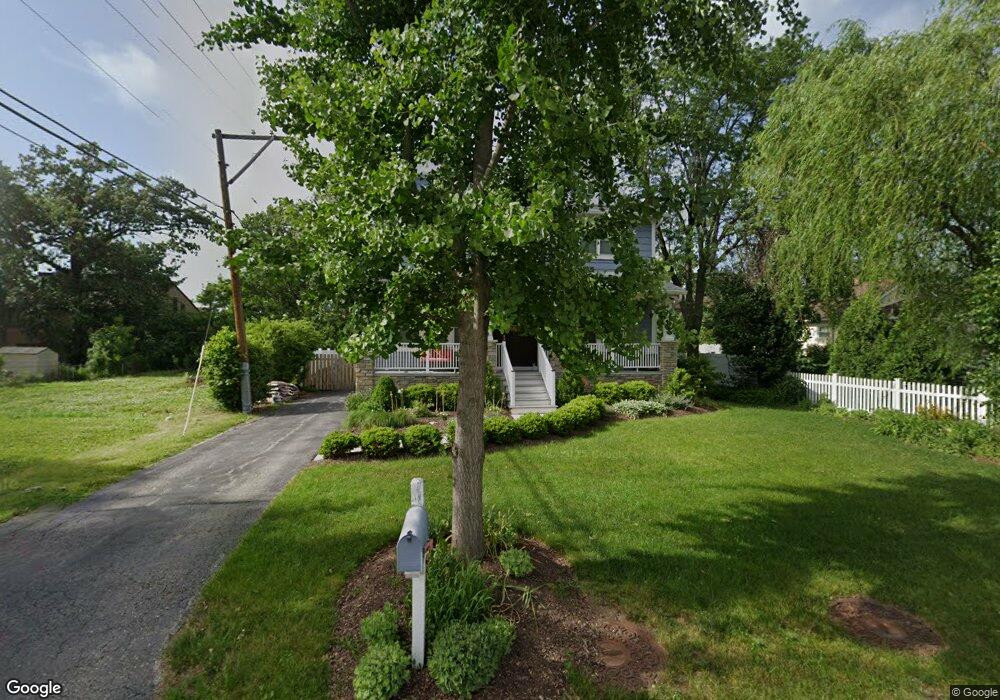
573 W 3rd St Elmhurst, IL 60126
Estimated Value: $403,000 - $711,000
--
Bed
--
Bath
2,406
Sq Ft
$238/Sq Ft
Est. Value
About This Home
This home is located at 573 W 3rd St, Elmhurst, IL 60126 and is currently estimated at $571,629, approximately $237 per square foot. 573 W 3rd St is a home located in DuPage County with nearby schools including Reinberg Elementary School, Ruggles Elementary School, and Hawthorne Elementary School.
Ownership History
Date
Name
Owned For
Owner Type
Purchase Details
Closed on
Oct 18, 1999
Sold by
Villa Park Trust & Svgs Bank
Bought by
Flores Edward and Flores Karen
Current Estimated Value
Home Financials for this Owner
Home Financials are based on the most recent Mortgage that was taken out on this home.
Original Mortgage
$157,000
Outstanding Balance
$46,211
Interest Rate
7.5%
Estimated Equity
$525,418
Purchase Details
Closed on
Apr 15, 1996
Sold by
West Suburban Bank
Bought by
Villa Park Trust & Svgs Bank and Trust #2284
Create a Home Valuation Report for This Property
The Home Valuation Report is an in-depth analysis detailing your home's value as well as a comparison with similar homes in the area
Home Values in the Area
Average Home Value in this Area
Purchase History
| Date | Buyer | Sale Price | Title Company |
|---|---|---|---|
| Flores Edward | $179,000 | -- | |
| Villa Park Trust & Svgs Bank | -- | -- | |
| Villa Park Trust & Svgs Bank | -- | -- |
Source: Public Records
Mortgage History
| Date | Status | Borrower | Loan Amount |
|---|---|---|---|
| Open | Flores Edward | $157,000 |
Source: Public Records
Tax History Compared to Growth
Tax History
| Year | Tax Paid | Tax Assessment Tax Assessment Total Assessment is a certain percentage of the fair market value that is determined by local assessors to be the total taxable value of land and additions on the property. | Land | Improvement |
|---|---|---|---|---|
| 2024 | $8,631 | $151,223 | $38,703 | $112,520 |
| 2023 | $8,004 | $139,840 | $35,790 | $104,050 |
| 2022 | $7,789 | $134,450 | $34,420 | $100,030 |
| 2021 | $7,593 | $131,100 | $33,560 | $97,540 |
| 2020 | $7,298 | $128,220 | $32,820 | $95,400 |
| 2019 | $7,139 | $121,900 | $31,200 | $90,700 |
| 2018 | $8,806 | $148,140 | $29,530 | $118,610 |
| 2017 | $8,612 | $141,170 | $28,140 | $113,030 |
| 2016 | $8,430 | $132,990 | $26,510 | $106,480 |
| 2015 | $6,575 | $123,900 | $24,700 | $99,200 |
| 2014 | $7,321 | $126,000 | $22,540 | $103,460 |
| 2013 | $7,270 | $127,780 | $22,860 | $104,920 |
Source: Public Records
Map
Nearby Homes
- 285 N Ridgeland Ave
- 407 W North Ave
- 17W517 Manor Ln
- 322 N Highland Ave
- 204 E Hill St
- 156 S Sunnyside Ave
- 412 N Ridgeland Ave
- 170 S Fairview Ave
- 355 W 1st St
- 196 N Walnut St
- 120 N Walnut St
- 442 N Oak St
- 656 W Comstock Ave
- 468 N Highland Ave
- 508 W Alma St
- 255 S West Ave Unit 214
- 255 S West Ave Unit 413
- 655 W Comstock Ave
- 117 E Vermont St
- 104 Evergreen Ave