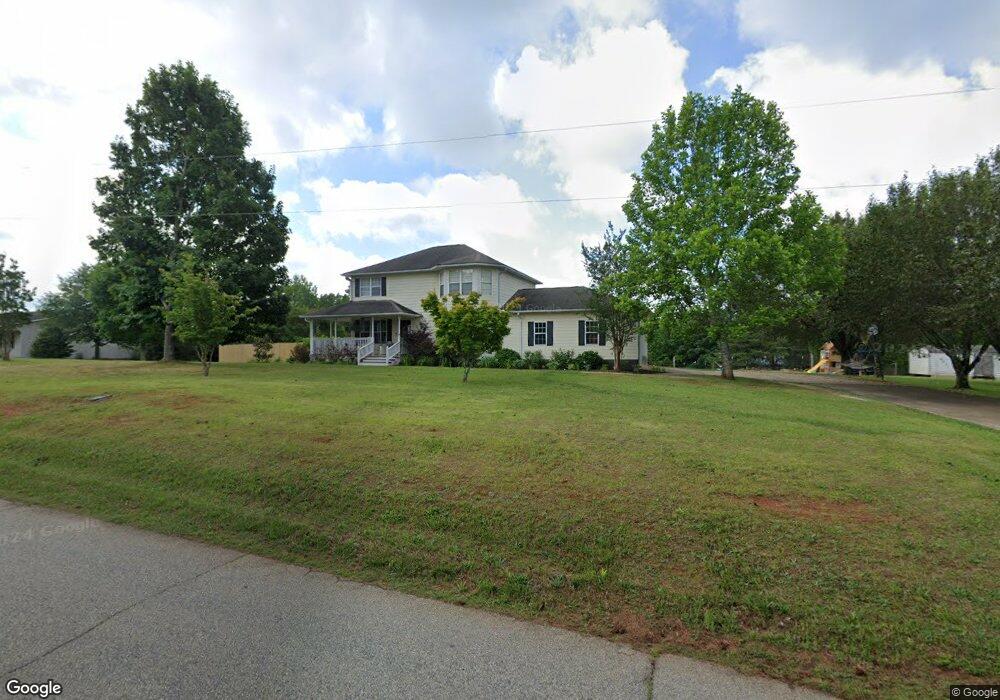
5730 Henderson Hill Rd Chesnee, SC 29323
Estimated Value: $294,000 - $368,422
3
Beds
2
Baths
1,724
Sq Ft
$184/Sq Ft
Est. Value
About This Home
This home is located at 5730 Henderson Hill Rd, Chesnee, SC 29323 and is currently estimated at $317,606, approximately $184 per square foot. 5730 Henderson Hill Rd is a home located in Spartanburg County with nearby schools including Mayo Elementary School, Chesnee Middle School, and Chesnee High School.
Ownership History
Date
Name
Owned For
Owner Type
Purchase Details
Closed on
Apr 29, 2020
Sold by
Bland William Barry
Bought by
Brannon Philip R and Brannon Shelby L
Current Estimated Value
Home Financials for this Owner
Home Financials are based on the most recent Mortgage that was taken out on this home.
Original Mortgage
$168,944
Outstanding Balance
$149,380
Interest Rate
3.3%
Mortgage Type
New Conventional
Estimated Equity
$168,226
Purchase Details
Closed on
Feb 19, 2015
Sold by
Bland Sarah
Bought by
Gardner Steven R and Gardner Helen B
Home Financials for this Owner
Home Financials are based on the most recent Mortgage that was taken out on this home.
Original Mortgage
$22,297
Interest Rate
3.74%
Mortgage Type
Purchase Money Mortgage
Purchase Details
Closed on
Apr 26, 2004
Sold by
Bell Kay
Bought by
Bell A Oliver
Purchase Details
Closed on
Mar 10, 2004
Sold by
Bland Sarah H
Bought by
Bell A Oliver and Bell Kay
Create a Home Valuation Report for This Property
The Home Valuation Report is an in-depth analysis detailing your home's value as well as a comparison with similar homes in the area
Home Values in the Area
Average Home Value in this Area
Purchase History
| Date | Buyer | Sale Price | Title Company |
|---|---|---|---|
| Brannon Philip R | $177,836 | None Available | |
| Gardner Steven R | $22,297 | -- | |
| Bell A Oliver | -- | -- | |
| Bell A Oliver | $4,050 | -- |
Source: Public Records
Mortgage History
| Date | Status | Borrower | Loan Amount |
|---|---|---|---|
| Open | Brannon Philip R | $168,944 | |
| Previous Owner | Gardner Steven R | $22,297 |
Source: Public Records
Tax History Compared to Growth
Tax History
| Year | Tax Paid | Tax Assessment Tax Assessment Total Assessment is a certain percentage of the fair market value that is determined by local assessors to be the total taxable value of land and additions on the property. | Land | Improvement |
|---|---|---|---|---|
| 2025 | $1,299 | $8,179 | $2,673 | $5,506 |
| 2024 | $1,299 | $8,179 | $2,673 | $5,506 |
| 2023 | $1,299 | $8,179 | $2,673 | $5,506 |
| 2022 | $1,178 | $7,112 | $2,500 | $4,612 |
| 2021 | $1,178 | $7,112 | $2,500 | $4,612 |
| 2020 | $841 | $5,036 | $462 | $4,574 |
| 2019 | $632 | $5,321 | $535 | $4,786 |
| 2018 | $617 | $5,321 | $535 | $4,786 |
| 2017 | $519 | $4,667 | $543 | $4,124 |
| 2016 | $519 | $4,667 | $543 | $4,124 |
| 2015 | $514 | $4,667 | $543 | $4,124 |
| 2014 | $533 | $4,737 | $613 | $4,124 |
Source: Public Records
Map
Nearby Homes
- 248 Jonestown Rd
- 130 Colonial Dr
- 164 Old Airport Rd
- 110 Buck Ridge Dr
- 712 Buck Creek Rd
- 236 Overhead Bridge Rd
- 418 Harbour View Dr
- 0 Paris Farm Rd Unit SPN328531
- 0 Paris Farm Rd Unit SPN328530
- 0 Paris Farm Rd Unit SPN328529
- 0 Paris Farm Rd Unit SPN328527
- 0 Paris Farm Rd Unit SPN328526
- 0 Paris Farm Rd Unit SPN328525
- 212 Quarterdeck Ct
- 310 Clarendon Ct
- 314 Shoreview Dr
- 220 Oak St
- 0 Cantrell Lot 2 Dr
- 0 Cantrell Lot 1 Dr
- 1010 Paula Parris Rd
- 5730 Henderson Hill Rd
- 5720 Henderson Hill Rd
- 5740 Henderson Hill Rd
- 5755 Henderson Hill Rd
- 5730 State Road S-42-1890
- 1476 Ezell Rd
- 5606 Henderson Hill Rd
- 0 Ezell Rd Unit 190322
- 0 Ezell Rd Unit 215040
- 0 Ezell Rd Unit 215038
- 0 Ezell Rd Unit 226670
- 0 Ezell Rd Unit 233109
- 0 Ezell Rd Unit 234808
- 0 Ezell Rd Unit 1287432
- 0 Ezell Rd Unit 1287427
- 0 Ezell Rd Unit SPN133690
- 1301 Ezell Rd
- 1315 Ezell Rd
- 1321 Ezell Rd
- 1329 Ezell Rd