Estimated Value: $392,000 - $432,000
5
Beds
3
Baths
1,894
Sq Ft
$217/Sq Ft
Est. Value
About This Home
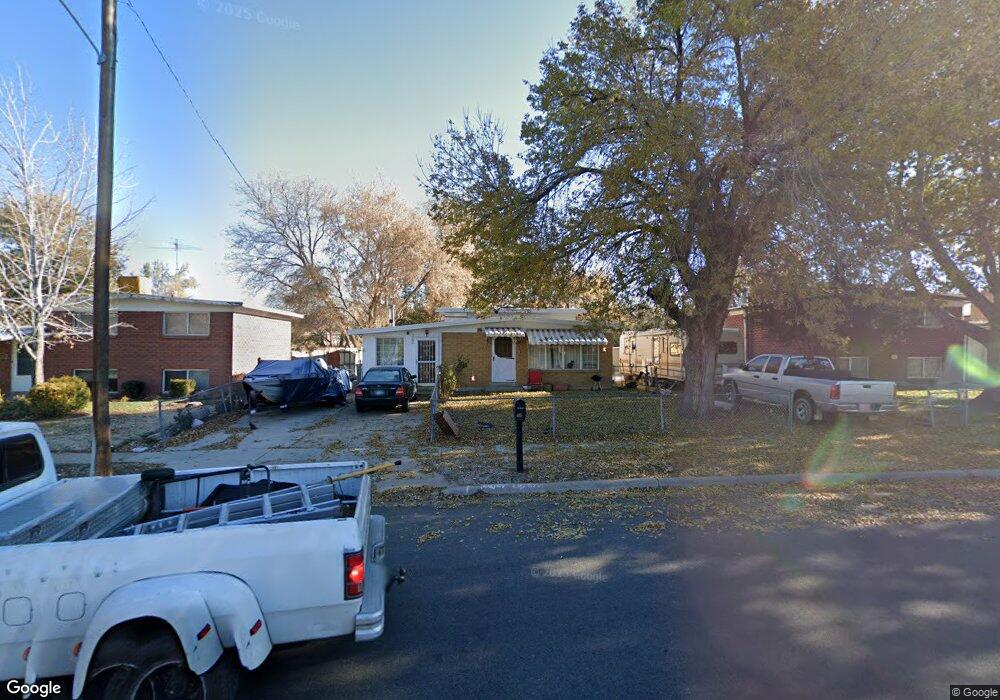
This home is located at 5730 S 2550 W, Roy, UT 84067 and is currently estimated at $411,750, approximately $217 per square foot. 5730 S 2550 W is a home located in Weber County with nearby schools including Roy Junior High School and Roy High School.
Ownership History
Date
Name
Owned For
Owner Type
Purchase Details
Closed on
Nov 25, 2024
Sold by
Treehouse Investments Llc
Bought by
Johnson Spencer and Johnson Rachel
Current Estimated Value
Home Financials for this Owner
Home Financials are based on the most recent Mortgage that was taken out on this home.
Original Mortgage
$402,734
Outstanding Balance
$399,269
Interest Rate
6.32%
Mortgage Type
FHA
Estimated Equity
$12,481
Purchase Details
Closed on
Jul 29, 2024
Sold by
Forte Sterling and Ellis Jennifer
Bought by
Treehouse Investments Llc
Purchase Details
Closed on
Mar 1, 2017
Sold by
Forte Sterling
Bought by
Forte Sterling and Ellis Jennifer
Home Financials for this Owner
Home Financials are based on the most recent Mortgage that was taken out on this home.
Original Mortgage
$97,520
Interest Rate
4.62%
Mortgage Type
FHA
Create a Home Valuation Report for This Property
The Home Valuation Report is an in-depth analysis detailing your home's value as well as a comparison with similar homes in the area
Home Values in the Area
Average Home Value in this Area
Purchase History
| Date | Buyer | Sale Price | Title Company |
|---|---|---|---|
| Johnson Spencer | -- | Metro National Title | |
| Treehouse Investments Llc | -- | Metro National Title | |
| Forte Sterling | -- | Old Republic Title | |
| Forte Sterling | -- | Old Republic Title | |
| Ellis Brian Franklin | -- | Old Republic Title |
Source: Public Records
Mortgage History
| Date | Status | Borrower | Loan Amount |
|---|---|---|---|
| Open | Johnson Spencer | $402,734 | |
| Previous Owner | Forte Sterling | $97,520 |
Source: Public Records
Tax History Compared to Growth
Tax History
| Year | Tax Paid | Tax Assessment Tax Assessment Total Assessment is a certain percentage of the fair market value that is determined by local assessors to be the total taxable value of land and additions on the property. | Land | Improvement |
|---|---|---|---|---|
| 2025 | $2,442 | $382,836 | $108,498 | $274,338 |
| 2024 | $2,359 | $372,000 | $108,514 | $263,486 |
| 2023 | $2,218 | $191,950 | $55,342 | $136,608 |
| 2022 | $2,425 | $218,350 | $53,248 | $165,102 |
| 2021 | $1,847 | $270,000 | $63,234 | $206,766 |
| 2020 | $1,742 | $234,000 | $63,234 | $170,766 |
| 2019 | $1,720 | $218,000 | $39,429 | $178,571 |
| 2018 | $1,549 | $183,000 | $34,772 | $148,228 |
| 2017 | $1,403 | $154,000 | $31,781 | $122,219 |
| 2016 | $191 | $75,696 | $17,103 | $58,593 |
| 2015 | $188 | $70,186 | $19,446 | $50,740 |
| 2014 | $186 | $65,100 | $14,728 | $50,372 |
Source: Public Records
Map
Nearby Homes
- 2571 W 5725 S
- 2587 W 5750 S
- 5810 S 2550 W
- 2646 W 5625 S Unit M-2646
- 5923 S 2625 W
- 5643 S 2200 W
- 2778 W 5550 S Unit 28
- 2829 W 5925 S
- 484 W 2650 N
- 480 W 2650 N
- 5345 S 2425 W
- 2612 N 525 W
- 2184 W 5500 S
- 5326 S 2675 W
- 428 W 2650 N
- 2602 N 2125 W
- 2593 N 500 W Unit 56
- 5545 S 2100 W Unit 12
- 5545 S 2100 W Unit 20
- 5545 S 2100 W Unit D22