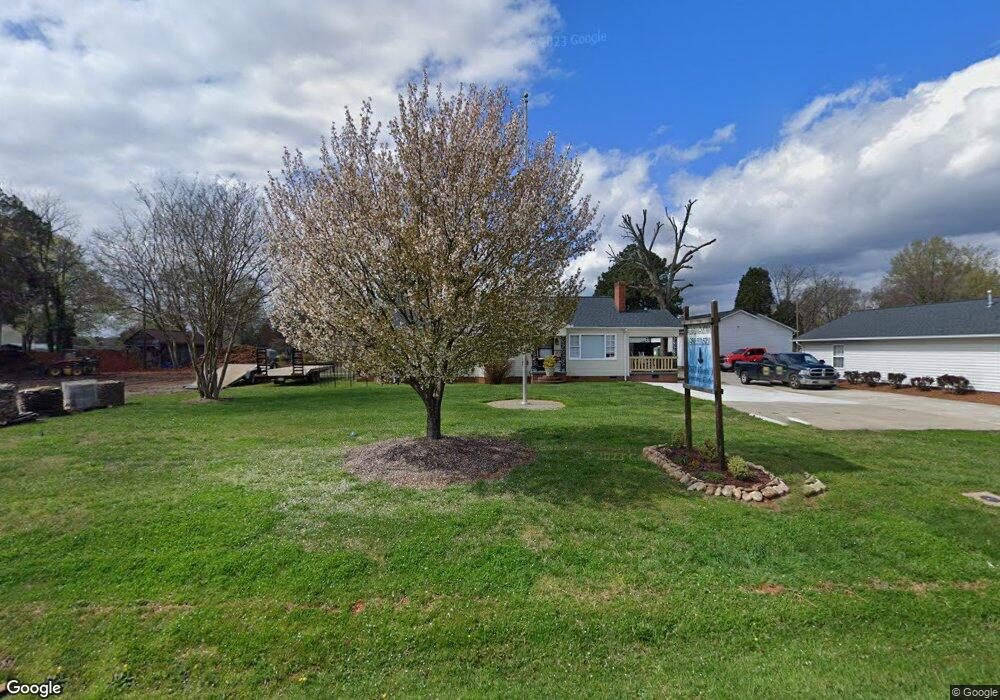
5730 S Main St Salisbury, NC 28147
Estimated Value: $224,000 - $248,477
--
Bed
1
Bath
1,393
Sq Ft
$170/Sq Ft
Est. Value
About This Home
This home is located at 5730 S Main St, Salisbury, NC 28147 and is currently estimated at $236,619, approximately $169 per square foot. 5730 S Main St is a home located in Rowan County with nearby schools including Knollwood Elementary School, Southeast Middle School, and Jesse C Carson High School.
Ownership History
Date
Name
Owned For
Owner Type
Purchase Details
Closed on
Feb 3, 2010
Sold by
Rule James Vernon and Rule Linda
Bought by
Power Rodney Dale
Current Estimated Value
Purchase Details
Closed on
Jun 5, 2009
Sold by
Small Mary L
Bought by
Small Mary L and Rule James Vernon
Purchase Details
Closed on
Mar 12, 2009
Sold by
Rule James Vernon and Rule Linda Hundley
Bought by
Rule James Vernon and Small Mary L
Create a Home Valuation Report for This Property
The Home Valuation Report is an in-depth analysis detailing your home's value as well as a comparison with similar homes in the area
Home Values in the Area
Average Home Value in this Area
Purchase History
| Date | Buyer | Sale Price | Title Company |
|---|---|---|---|
| Power Rodney Dale | $55,000 | None Available | |
| Small Mary L | -- | None Available | |
| Rule James Vernon | -- | None Available |
Source: Public Records
Tax History Compared to Growth
Tax History
| Year | Tax Paid | Tax Assessment Tax Assessment Total Assessment is a certain percentage of the fair market value that is determined by local assessors to be the total taxable value of land and additions on the property. | Land | Improvement |
|---|---|---|---|---|
| 2025 | $1,477 | $217,961 | $35,750 | $182,211 |
| 2024 | $1,477 | $217,961 | $35,750 | $182,211 |
| 2023 | $1,477 | $217,961 | $35,750 | $182,211 |
| 2022 | $1,214 | $160,749 | $35,750 | $124,999 |
| 2021 | $1,202 | $160,749 | $35,750 | $124,999 |
| 2020 | $1,202 | $160,749 | $35,750 | $124,999 |
| 2019 | $1,202 | $160,749 | $35,750 | $124,999 |
| 2018 | $1,182 | $159,413 | $35,750 | $123,663 |
| 2017 | $1,182 | $159,413 | $35,750 | $123,663 |
| 2016 | $1,182 | $159,413 | $35,750 | $123,663 |
| 2015 | $1,196 | $159,413 | $35,750 | $123,663 |
| 2014 | $719 | $100,599 | $41,250 | $59,349 |
Source: Public Records
Map
Nearby Homes
- 355 Swink Ave
- 0 Swink Ave
- 6000 S Main St
- 6115 Southern Ln
- 179 Spring Oak Dr
- 6255 Meadow Ln
- 00 Neelytown Rd
- 0 Brookfield Cir Unit CAR4292885
- 0 Ed Weavers Rd
- 1140 Peeler Rd
- 1352 Eva Ln
- 1675 N Main St
- 110 Venture Dr
- 130 Lois Ln
- 3080 Shue Rd
- 400 Black Bear St Unit 154p
- TA3000 Plan at Kensington
- Hudson Plan at Kensington
- Devin Plan at Kensington
- Bayside Plan at Kensington
- 5732 S Main St
- 5690 S Main St
- 5635 Bertie Ave
- 5655 Bertie Ave
- 180 Midway Dr
- 5675 Bertie Ave
- 5670 S Main St
- 5625 S Main St
- 5555 Bertie Ave
- 5555 Bertie Ave
- 5555 Bertie Ave
- 5735 Bertie Ave
- 5630 Bertie Ave
- 5650 Bertie Ave
- 5660 S Main St
- 5525 Bertie Ave
- 5525 Bertie Ave Unit L42-45
- 210 Midway Dr
- 5680 Bertie Ave
- 5755 Bertie Ave