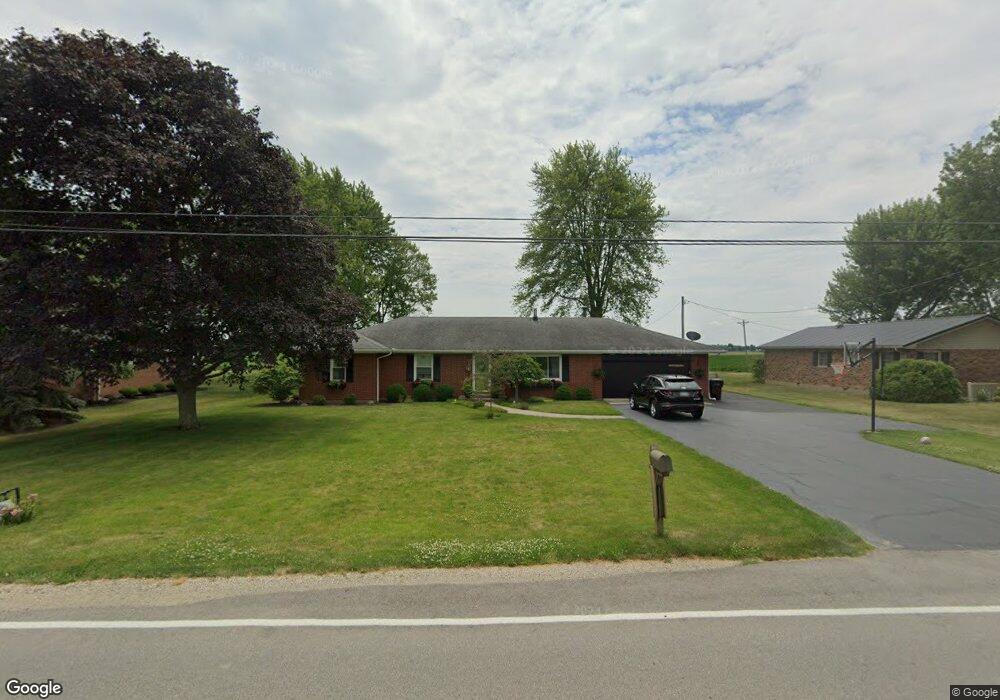
5731 Arcanum Hollansburg Rd Arcanum, OH 45304
Estimated Value: $221,000 - $260,000
3
Beds
2
Baths
1,473
Sq Ft
$159/Sq Ft
Est. Value
About This Home
This home is located at 5731 Arcanum Hollansburg Rd, Arcanum, OH 45304 and is currently estimated at $234,364, approximately $159 per square foot. 5731 Arcanum Hollansburg Rd is a home located in Darke County with nearby schools including Arcanum Elementary School, Butler Middle School, and Arcanum High School.
Ownership History
Date
Name
Owned For
Owner Type
Purchase Details
Closed on
Apr 2, 2015
Sold by
Dendler William T and Dendler Marsha
Bought by
Noe James P and Noe Trista E
Current Estimated Value
Home Financials for this Owner
Home Financials are based on the most recent Mortgage that was taken out on this home.
Original Mortgage
$123,500
Outstanding Balance
$95,176
Interest Rate
3.77%
Mortgage Type
New Conventional
Estimated Equity
$139,188
Purchase Details
Closed on
Jul 7, 2010
Sold by
Dendler Kelle D
Bought by
Dendler William T
Purchase Details
Closed on
Sep 18, 1997
Sold by
Kinnison Herman E
Bought by
Dendler William T and Dendler Kelle D
Home Financials for this Owner
Home Financials are based on the most recent Mortgage that was taken out on this home.
Original Mortgage
$82,650
Interest Rate
7.55%
Mortgage Type
New Conventional
Purchase Details
Closed on
Nov 21, 1991
Bought by
Noe James P and Noe Trista E
Create a Home Valuation Report for This Property
The Home Valuation Report is an in-depth analysis detailing your home's value as well as a comparison with similar homes in the area
Home Values in the Area
Average Home Value in this Area
Purchase History
| Date | Buyer | Sale Price | Title Company |
|---|---|---|---|
| Noe James P | $195,000 | Attorney | |
| Dendler William T | -- | Attorney | |
| Dendler William T | $87,000 | -- | |
| Noe James P | -- | -- |
Source: Public Records
Mortgage History
| Date | Status | Borrower | Loan Amount |
|---|---|---|---|
| Open | Noe James P | $123,500 | |
| Previous Owner | Dendler William T | $82,650 |
Source: Public Records
Tax History Compared to Growth
Tax History
| Year | Tax Paid | Tax Assessment Tax Assessment Total Assessment is a certain percentage of the fair market value that is determined by local assessors to be the total taxable value of land and additions on the property. | Land | Improvement |
|---|---|---|---|---|
| 2024 | $2,051 | $57,770 | $5,120 | $52,650 |
| 2023 | $2,054 | $57,770 | $5,120 | $52,650 |
| 2022 | $1,943 | $49,180 | $4,270 | $44,910 |
| 2021 | $1,960 | $49,180 | $4,270 | $44,910 |
| 2020 | $1,901 | $49,180 | $4,270 | $44,910 |
| 2019 | $1,693 | $43,890 | $4,270 | $39,620 |
| 2018 | $1,681 | $43,890 | $4,270 | $39,620 |
| 2017 | $1,496 | $43,890 | $4,270 | $39,620 |
| 2016 | $1,079 | $41,260 | $6,410 | $34,850 |
| 2015 | $1,079 | $30,560 | $6,410 | $24,150 |
| 2014 | $1,092 | $30,560 | $6,410 | $24,150 |
| 2013 | $1,145 | $30,320 | $6,410 | $23,910 |
Source: Public Records
Map
Nearby Homes
- 20 Wheatland Dr
- 21 Wheatland Dr
- 8 Harvest Dr
- 3 Harvest Dr
- 9 Harvest Dr
- 604 W North St
- 406 W South St
- Oh-722
- 22 Greenmoor Dr
- 8 Meadowlawn Dr
- 8 Parkdale Dr
- 9 Seminole Ln
- 2 Edgewood Dr
- Alt St Rt 49 Alt State Route 49
- 6977 Alternate State Route 49
- 3847 Drew Rd
- 3794 State Route 49
- 3878 State Route 49
- 6254 State Route 722
- 4289 Weaver Fort Jefferson Rd
- 5741 Arcanum Hollansburg Rd
- 5723 Arcanum Hollansburg Rd
- 5741 Hollansburg Arcanum Rd
- 5751 Arcanum Hollansburg Rd
- 5703 Arcanum Hollansburg Rd
- 5767 Arcanum Hollansburg Rd
- 5767 Hollansburg-Arcanum Rd
- 5767 Hollansburg Arcanum Rd
- 5702 Arcanum Hollansburg Rd
- 5795 Arcanum Hollansburg Rd
- 2540 Tillman Rd
- 5672 Arcanum Hollansburg Rd
- 2550 Tillman Rd
- 5669 Arcanum Hollansburg Rd
- 5652 Arcanum Hollansburg Rd
- 2564 Tillman Rd
- 5642 Arcanum Hollansburg Rd
- 5643 Arcanum Hollansburg Rd
- 2576 Tillman Rd
- 2580 Tillman Rd