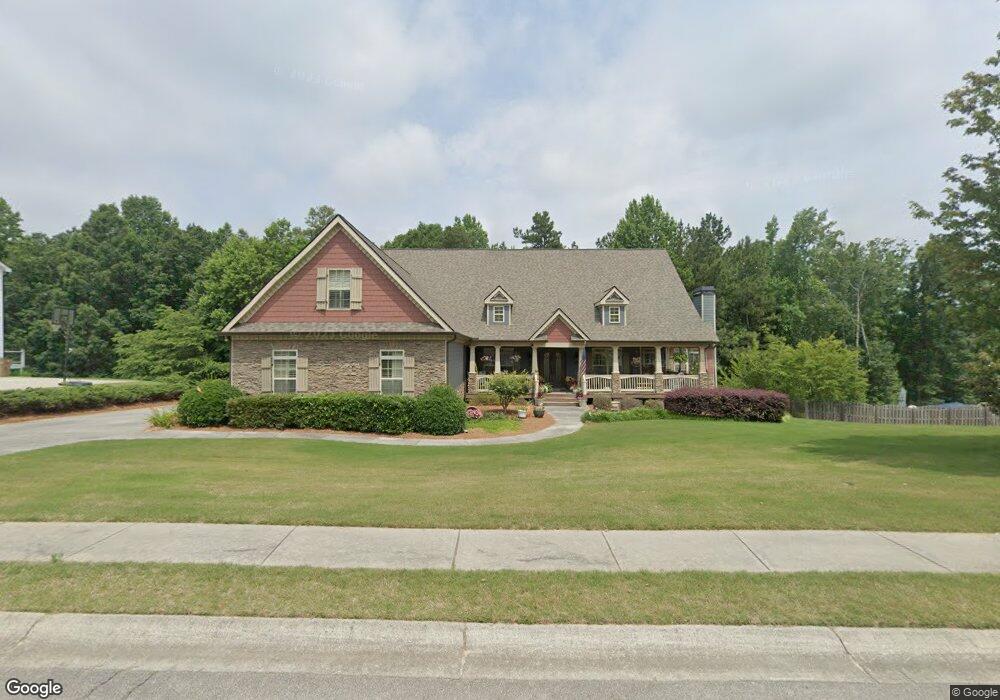
5731 Boulder Ridge Ct Flowery Branch, GA 30542
Estimated Value: $601,000 - $643,000
4
Beds
4
Baths
3,322
Sq Ft
$186/Sq Ft
Est. Value
About This Home
This home is located at 5731 Boulder Ridge Ct, Flowery Branch, GA 30542 and is currently estimated at $616,747, approximately $185 per square foot. 5731 Boulder Ridge Ct is a home located in Hall County with nearby schools including Friendship Elementary School, C.W. Davis Middle School, and Flowery Branch High School.
Ownership History
Date
Name
Owned For
Owner Type
Purchase Details
Closed on
Aug 25, 2015
Sold by
Hitt Henry Hollis
Bought by
Hitt Henry H and Hitt Audrey D
Current Estimated Value
Home Financials for this Owner
Home Financials are based on the most recent Mortgage that was taken out on this home.
Original Mortgage
$261,000
Outstanding Balance
$101,436
Interest Rate
3.25%
Mortgage Type
New Conventional
Estimated Equity
$515,311
Purchase Details
Closed on
Dec 21, 2005
Sold by
Greenwood Builder Group Inc
Bought by
Hitt Henry Hollis
Home Financials for this Owner
Home Financials are based on the most recent Mortgage that was taken out on this home.
Original Mortgage
$230,000
Interest Rate
6.29%
Mortgage Type
New Conventional
Purchase Details
Closed on
Jul 30, 2004
Bought by
Gilleland-Merritt Llc
Home Financials for this Owner
Home Financials are based on the most recent Mortgage that was taken out on this home.
Original Mortgage
$215,925
Interest Rate
6.19%
Create a Home Valuation Report for This Property
The Home Valuation Report is an in-depth analysis detailing your home's value as well as a comparison with similar homes in the area
Home Values in the Area
Average Home Value in this Area
Purchase History
| Date | Buyer | Sale Price | Title Company |
|---|---|---|---|
| Hitt Henry H | -- | -- | |
| Hitt Henry Hollis | $368,200 | -- | |
| Gilleland-Merritt Llc | -- | -- |
Source: Public Records
Mortgage History
| Date | Status | Borrower | Loan Amount |
|---|---|---|---|
| Open | Hitt Henry H | $261,000 | |
| Previous Owner | Hitt Henry Hollis | $230,000 | |
| Previous Owner | Gilleland-Merritt Llc | $215,925 |
Source: Public Records
Tax History Compared to Growth
Tax History
| Year | Tax Paid | Tax Assessment Tax Assessment Total Assessment is a certain percentage of the fair market value that is determined by local assessors to be the total taxable value of land and additions on the property. | Land | Improvement |
|---|---|---|---|---|
| 2024 | $5,265 | $207,720 | $16,080 | $191,640 |
| 2023 | $4,748 | $202,400 | $16,080 | $186,320 |
| 2022 | $4,316 | $162,400 | $16,080 | $146,320 |
| 2021 | $4,281 | $158,080 | $16,080 | $142,000 |
| 2020 | $4,197 | $150,480 | $16,080 | $134,400 |
| 2019 | $4,129 | $146,680 | $16,080 | $130,600 |
| 2018 | $4,128 | $141,960 | $16,080 | $125,880 |
| 2017 | $3,902 | $135,440 | $16,080 | $119,360 |
| 2016 | $3,810 | $135,440 | $16,080 | $119,360 |
| 2015 | $3,136 | $109,910 | $12,840 | $97,070 |
| 2014 | $3,136 | $109,910 | $12,840 | $97,070 |
Source: Public Records
Map
Nearby Homes
- 0 Boulder Ridge Ct Unit 7438491
- 0 Boulder Ridge Ct Unit 8321237
- 0 Boulder Ridge Ct Unit 8247645
- 0 Boulder Ridge Ct Unit 8191913
- 0 Boulder Ridge Ct Unit 7568050
- 0 Boulder Ridge Ct Unit 7640304
- 0 Boulder Ridge Ct Unit 7349090
- 0 Boulder Ridge Ct Unit 7065335
- 0 Boulder Ridge Ct Unit 7092363
- 0 Boulder Ridge Ct Unit 7129807
- 0 Boulder Ridge Ct Unit 7245083
- 0 Boulder Ridge Ct
- 5727 Boulder Ridge Ct
- 5723 Boulder Ridge Ct
- 5736 Boulder Ridge Ct
- 5724 Boulder Ridge Ct
- 5719 Boulder Ridge Ct
- 5810 Cliff Valley Way
- 5718 Boulder Ridge Ct
- 5819 Cliff Valley Way