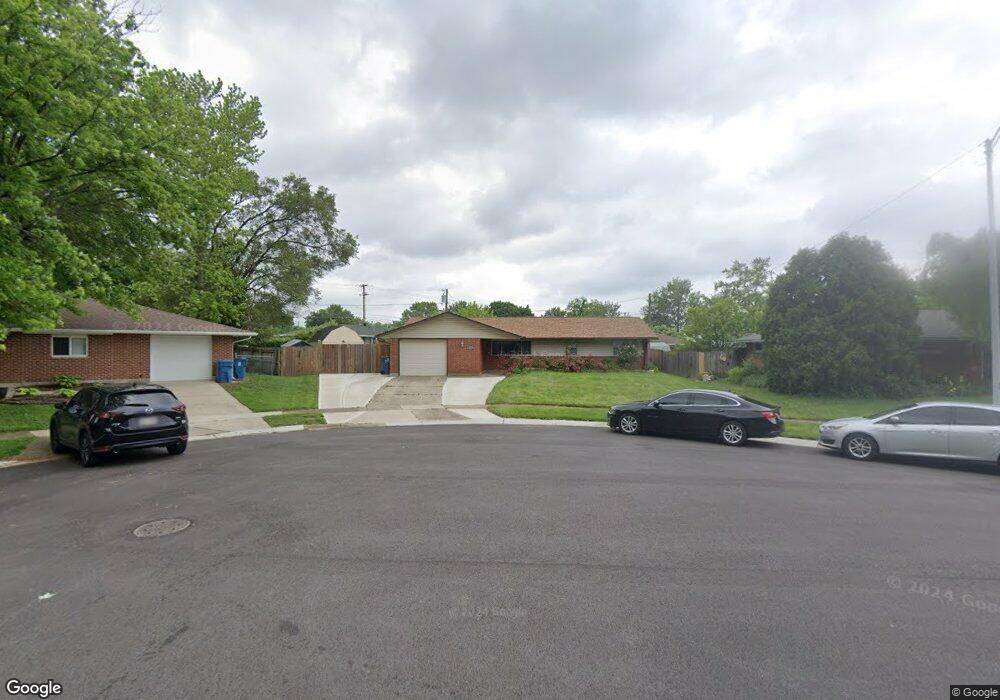
5733 Hubbard Ct Dayton, OH 45424
Estimated Value: $201,000 - $219,000
3
Beds
2
Baths
1,301
Sq Ft
$160/Sq Ft
Est. Value
About This Home
This home is located at 5733 Hubbard Ct, Dayton, OH 45424 and is currently estimated at $208,582, approximately $160 per square foot. 5733 Hubbard Ct is a home located in Montgomery County with nearby schools including Wayne High School and Huber Heights Christian Academy.
Ownership History
Date
Name
Owned For
Owner Type
Purchase Details
Closed on
Sep 28, 2020
Sold by
Ramsey Jared S
Bought by
Nguyen Phong T and Nguyen Hang T
Current Estimated Value
Home Financials for this Owner
Home Financials are based on the most recent Mortgage that was taken out on this home.
Original Mortgage
$120,000
Interest Rate
2.9%
Mortgage Type
New Conventional
Purchase Details
Closed on
Apr 17, 2015
Sold by
Ulrich Joel A and Ulrich Christina M
Bought by
Ramsey Jared S
Home Financials for this Owner
Home Financials are based on the most recent Mortgage that was taken out on this home.
Original Mortgage
$76,050
Interest Rate
3.85%
Mortgage Type
New Conventional
Purchase Details
Closed on
May 16, 2001
Sold by
Wells Timothy E and Wells Myra E
Bought by
Ulrich Joel A and Ulrich Christina M
Home Financials for this Owner
Home Financials are based on the most recent Mortgage that was taken out on this home.
Original Mortgage
$87,210
Interest Rate
7.02%
Mortgage Type
FHA
Purchase Details
Closed on
Nov 9, 1993
Sold by
Casey James M
Bought by
Kinder Jerry W
Create a Home Valuation Report for This Property
The Home Valuation Report is an in-depth analysis detailing your home's value as well as a comparison with similar homes in the area
Home Values in the Area
Average Home Value in this Area
Purchase History
| Date | Buyer | Sale Price | Title Company |
|---|---|---|---|
| Nguyen Phong T | $150,000 | Landmark Ttl Agcy South Inc | |
| Ramsey Jared S | $84,500 | Attorney | |
| Ulrich Joel A | $87,900 | Title Pointe Agency Inc | |
| Kinder Jerry W | -- | Landmark Title |
Source: Public Records
Mortgage History
| Date | Status | Borrower | Loan Amount |
|---|---|---|---|
| Previous Owner | Nguyen Phong T | $120,000 | |
| Previous Owner | Ramsey Jared S | $76,050 | |
| Previous Owner | Ulrich Joel A | $87,210 |
Source: Public Records
Tax History Compared to Growth
Tax History
| Year | Tax Paid | Tax Assessment Tax Assessment Total Assessment is a certain percentage of the fair market value that is determined by local assessors to be the total taxable value of land and additions on the property. | Land | Improvement |
|---|---|---|---|---|
| 2024 | $2,606 | $50,590 | $10,150 | $40,440 |
| 2023 | $2,606 | $50,590 | $10,150 | $40,440 |
| 2022 | $2,438 | $34,850 | $7,000 | $27,850 |
| 2021 | $2,469 | $34,850 | $7,000 | $27,850 |
| 2020 | $2,470 | $34,850 | $7,000 | $27,850 |
| 2019 | $2,443 | $30,460 | $7,000 | $23,460 |
| 2018 | $2,451 | $30,460 | $7,000 | $23,460 |
| 2017 | $2,278 | $30,460 | $7,000 | $23,460 |
| 2016 | $2,169 | $28,250 | $7,000 | $21,250 |
| 2015 | $2,141 | $28,250 | $7,000 | $21,250 |
| 2014 | $2,141 | $28,250 | $7,000 | $21,250 |
| 2012 | -- | $31,200 | $9,630 | $21,570 |
Source: Public Records
Map
Nearby Homes
- 6529 Harshmanville Rd
- 5248 Tilbury Rd
- 5926 Chambersburg Rd
- 5135 Chesham Dr
- 5625 Copley Cir
- 5904 Troy Villa Blvd Unit 20051
- 6800 Cicero Ct
- 6109 Ansbury Dr
- 5159 Fishburg Rd
- 6119 Rosebury Dr
- 4944 Chesham Dr
- 7126 Mandrake Dr
- 5004 Fishburg Rd
- 5455 Flotron Dr
- 5983 Harshmanville Rd
- 6246 Old Troy Pike
- 5897 Troy Villa Blvd
- 6245 Longford Rd
- 5893 Tomberg St
- 5637 Troy Villa Blvd Unit 20088
- 5753 Hubbard Ct
- 5713 Hubbard Ct
- 5473 Chambersburg Rd
- 6516 Harshmanville Rd
- 5481 Chambersburg Rd
- 6534 Harshmanville Rd
- 6552 Harshmanville Rd
- 6512 Harshmanville Rd
- 5489 Chambersburg Rd
- 5720 Hubbard Ct
- 5750 Hubbard Ct
- 5497 Chambersburg Rd
- 5730 Hubbard Ct
- 6602 Harshmanville Rd
- 6517 Harshmanville Rd
- 6616 Harshmanville Rd
- 5474 Chambersburg Rd
- 5482 Chambersburg Rd
- 6537 Harshmanville Rd
- 6509 Harshmanville Rd