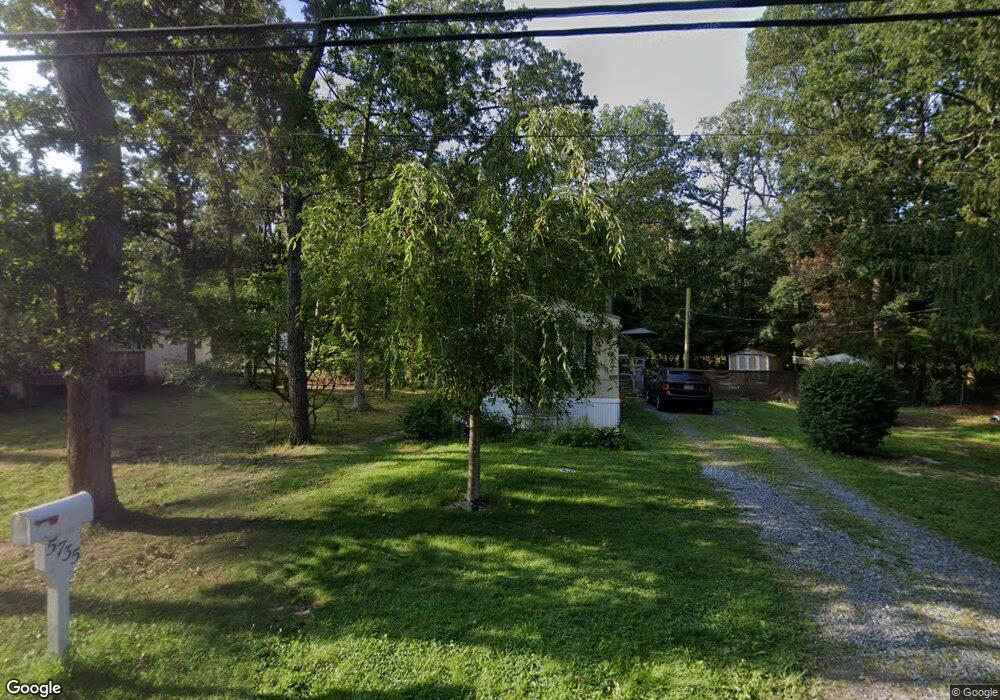
5735 Doris Dr Millville, NJ 08332
Estimated Value: $143,832 - $220,000
Studio
--
Bath
994
Sq Ft
$184/Sq Ft
Est. Value
About This Home
This home is located at 5735 Doris Dr, Millville, NJ 08332 and is currently estimated at $183,208, approximately $184 per square foot. 5735 Doris Dr is a home located in Cumberland County with nearby schools including Commercial Township School and Port Norris Elementary School.
Ownership History
Date
Name
Owned For
Owner Type
Purchase Details
Closed on
Feb 13, 2018
Sold by
Austino Robert A
Bought by
Shore Management Co Of De
Current Estimated Value
Purchase Details
Closed on
Feb 5, 2018
Sold by
Shore Management Co Of De
Bought by
Nocon Kevin H
Purchase Details
Closed on
Aug 31, 2005
Sold by
Stott Barbara A
Bought by
Lawless Edward
Purchase Details
Closed on
Oct 6, 1998
Sold by
Lazareff Lawrence E
Bought by
Smith Karleen P
Create a Home Valuation Report for This Property
The Home Valuation Report is an in-depth analysis detailing your home's value as well as a comparison with similar homes in the area
Home Values in the Area
Average Home Value in this Area
Purchase History
| Date | Buyer | Sale Price | Title Company |
|---|---|---|---|
| Shore Management Co Of De | $1,800 | -- | |
| Nocon Kevin H | $15,000 | -- | |
| Lawless Edward | $73,000 | -- | |
| Smith Karleen P | $1,004,670 | -- |
Source: Public Records
Tax History
| Year | Tax Paid | Tax Assessment Tax Assessment Total Assessment is a certain percentage of the fair market value that is determined by local assessors to be the total taxable value of land and additions on the property. | Land | Improvement |
|---|---|---|---|---|
| 2025 | $1,396 | $46,600 | $18,900 | $27,700 |
| 2024 | $1,396 | $46,600 | $18,900 | $27,700 |
| 2023 | $1,379 | $46,600 | $18,900 | $27,700 |
| 2022 | $1,363 | $46,600 | $18,900 | $27,700 |
| 2021 | $1,339 | $46,600 | $18,900 | $27,700 |
| 2020 | $1,310 | $46,600 | $18,900 | $27,700 |
| 2019 | $1,214 | $46,600 | $18,900 | $27,700 |
| 2018 | $2,129 | $81,400 | $32,900 | $48,500 |
| 2017 | $2,048 | $81,400 | $32,900 | $48,500 |
| 2016 | $1,978 | $81,400 | $32,900 | $48,500 |
| 2015 | $1,993 | $81,400 | $32,900 | $48,500 |
| 2014 | $1,913 | $81,400 | $32,900 | $48,500 |
Source: Public Records
Map
Nearby Homes
Your Personal Tour Guide
Ask me questions while you tour the home.