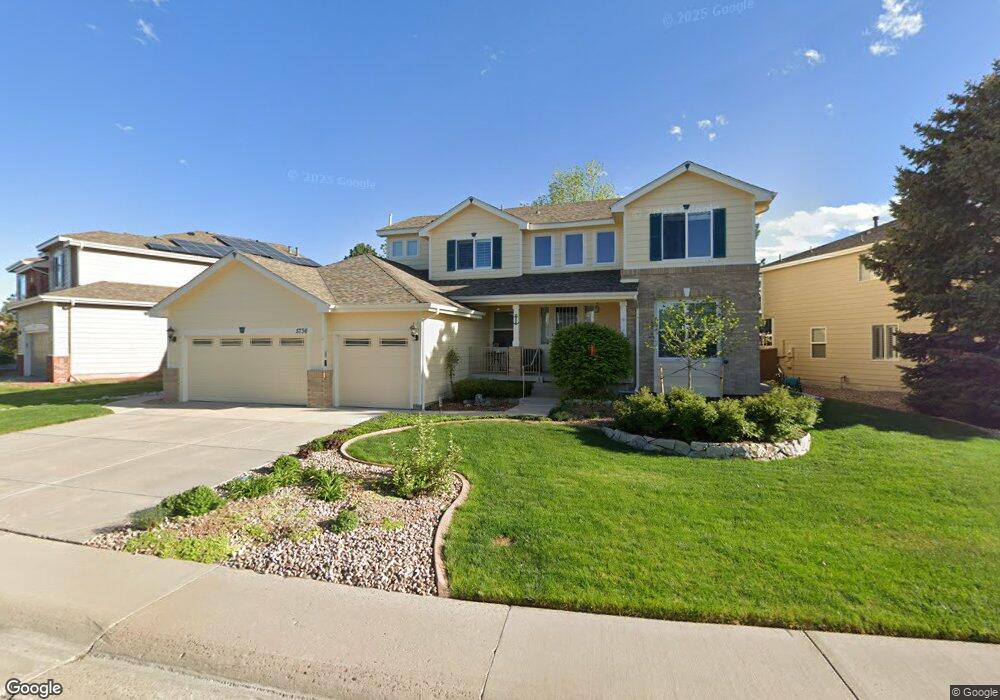
5736 Glenstone Dr Highlands Ranch, CO 80130
Eastridge NeighborhoodEstimated Value: $845,425 - $926,000
5
Beds
4
Baths
2,528
Sq Ft
$353/Sq Ft
Est. Value
About This Home
This home is located at 5736 Glenstone Dr, Highlands Ranch, CO 80130 and is currently estimated at $892,356, approximately $352 per square foot. 5736 Glenstone Dr is a home located in Douglas County with nearby schools including Redstone Elementary School, Rocky Heights Middle School, and Rock Canyon High School.
Ownership History
Date
Name
Owned For
Owner Type
Purchase Details
Closed on
Dec 10, 2007
Sold by
Abed Kamal A
Bought by
Abed Kamal
Current Estimated Value
Home Financials for this Owner
Home Financials are based on the most recent Mortgage that was taken out on this home.
Original Mortgage
$237,200
Outstanding Balance
$149,593
Interest Rate
6.23%
Mortgage Type
New Conventional
Estimated Equity
$742,763
Purchase Details
Closed on
Mar 25, 2002
Sold by
Abed Kamal and Abed Mary K
Bought by
Abed Kamal A
Home Financials for this Owner
Home Financials are based on the most recent Mortgage that was taken out on this home.
Original Mortgage
$255,500
Interest Rate
6.83%
Purchase Details
Closed on
Sep 19, 1997
Sold by
Joyce Homes Inc
Bought by
Abed Kamal and Abed Mary K
Home Financials for this Owner
Home Financials are based on the most recent Mortgage that was taken out on this home.
Original Mortgage
$186,000
Interest Rate
7.56%
Purchase Details
Closed on
Aug 29, 1996
Sold by
Mission Viejo Co
Bought by
Joyce Homes Inc
Create a Home Valuation Report for This Property
The Home Valuation Report is an in-depth analysis detailing your home's value as well as a comparison with similar homes in the area
Home Values in the Area
Average Home Value in this Area
Purchase History
| Date | Buyer | Sale Price | Title Company |
|---|---|---|---|
| Abed Kamal | -- | Multiple | |
| Abed Kamal A | -- | -- | |
| Abed Kamal | $258,241 | Land Title | |
| Joyce Homes Inc | $204,400 | -- |
Source: Public Records
Mortgage History
| Date | Status | Borrower | Loan Amount |
|---|---|---|---|
| Open | Abed Kamal | $237,200 | |
| Closed | Abed Kamal A | $255,500 | |
| Closed | Abed Kamal | $186,000 |
Source: Public Records
Tax History Compared to Growth
Tax History
| Year | Tax Paid | Tax Assessment Tax Assessment Total Assessment is a certain percentage of the fair market value that is determined by local assessors to be the total taxable value of land and additions on the property. | Land | Improvement |
|---|---|---|---|---|
| 2024 | $4,417 | $57,250 | $13,140 | $44,110 |
| 2023 | $4,409 | $57,250 | $13,140 | $44,110 |
| 2022 | $3,154 | $41,470 | $9,540 | $31,930 |
| 2021 | $3,280 | $41,470 | $9,540 | $31,930 |
| 2020 | $2,990 | $39,380 | $8,800 | $30,580 |
| 2019 | $3,666 | $39,380 | $8,800 | $30,580 |
| 2018 | $3,512 | $37,160 | $8,530 | $28,630 |
| 2017 | $3,198 | $37,160 | $8,530 | $28,630 |
| 2016 | $3,114 | $35,520 | $8,480 | $27,040 |
| 2015 | $3,181 | $35,520 | $8,480 | $27,040 |
| 2014 | $2,890 | $29,800 | $7,320 | $22,480 |
Source: Public Records
Map
Nearby Homes
- 9720 Sydney Ln
- 9735 Queenscliffe Dr
- 10078 Apollo Bay Way
- 10278 Dan Ct
- 5632 Tory Pointe
- 4925 Kingston Ave
- 10292 Nickolas Ave
- 10296 Lauren Ct
- 4907 Fenwood Dr
- 10439 Cheetah Winds
- 4758 Adelaide Place
- 4848 Fenwood Dr
- 10445 Cheetah Winds
- 4967 Waldenwood Dr
- 6717 Millstone St
- 9495 Morning Glory Way
- 4931 Waldenwood Dr
- 10048 Brisbane Way
- 6109 Trailhead Rd
- 6141 Trailhead Rd
- 5748 Glenstone Dr
- 5730 Glenstone Dr
- 5753 Glenstone Ln
- 5724 Glenstone Dr
- 5760 Glenstone Dr
- 5741 Glenstone Ln
- 5737 Glenstone Dr
- 5731 Glenstone Dr
- 5749 Glenstone Dr
- 5743 Glenstone Dr
- 5725 Glenstone Dr
- 5718 Glenstone Dr
- 5755 Glenstone Dr
- 5729 Glenstone Ln
- 5761 Glenstone Dr
- 5719 Glenstone Dr
- 5754 Glenstone Ln
- 5764 Glenstone Ln
- 5712 Glenstone Dr
- 5767 Glenstone Dr