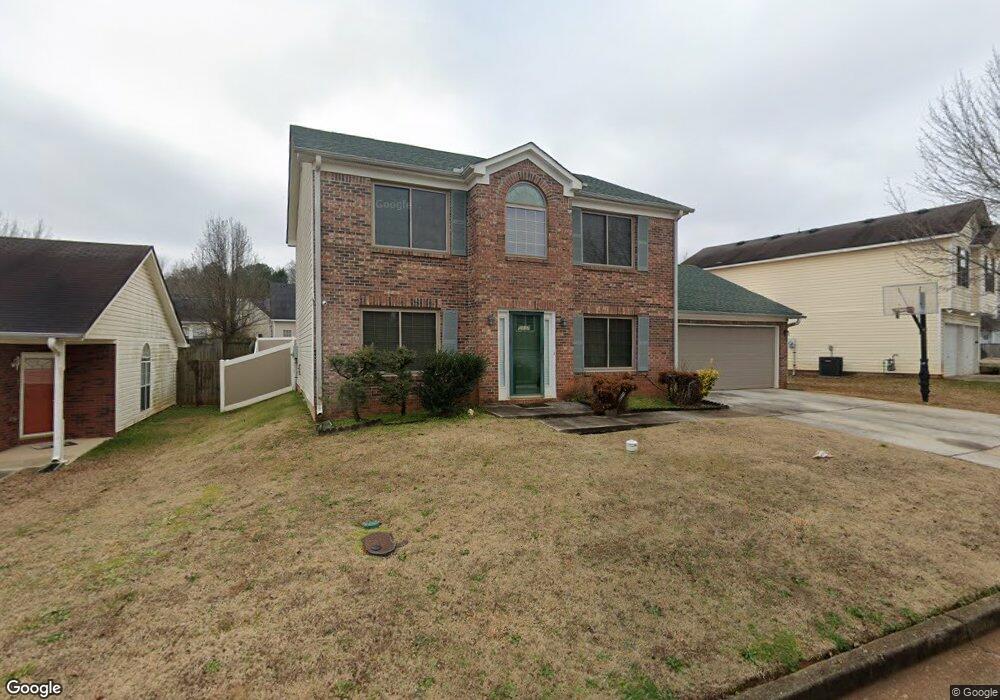
5737 Cedar Croft Ln Unit 3 Lithonia, GA 30058
Estimated Value: $255,933 - $295,000
3
Beds
3
Baths
1,944
Sq Ft
$138/Sq Ft
Est. Value
About This Home
This home is located at 5737 Cedar Croft Ln Unit 3, Lithonia, GA 30058 and is currently estimated at $268,733, approximately $138 per square foot. 5737 Cedar Croft Ln Unit 3 is a home located in DeKalb County with nearby schools including Panola Way Elementary School, Miller Grove Middle School, and Miller Grove High School.
Ownership History
Date
Name
Owned For
Owner Type
Purchase Details
Closed on
Jun 21, 2024
Sold by
Wilson Marjorie
Bought by
Wilson Marjorie and Stewart Samoy
Current Estimated Value
Purchase Details
Closed on
Sep 28, 2000
Sold by
Parkes Karen and Parkes Joyce
Bought by
Lightbourn Samuel and Lightbourn Marjorie
Home Financials for this Owner
Home Financials are based on the most recent Mortgage that was taken out on this home.
Original Mortgage
$131,288
Interest Rate
7.91%
Mortgage Type
FHA
Purchase Details
Closed on
Oct 15, 1999
Sold by
Jacor Inc
Bought by
Parkes Karen and Parkes Joyce
Home Financials for this Owner
Home Financials are based on the most recent Mortgage that was taken out on this home.
Original Mortgage
$108,742
Interest Rate
7.85%
Mortgage Type
FHA
Create a Home Valuation Report for This Property
The Home Valuation Report is an in-depth analysis detailing your home's value as well as a comparison with similar homes in the area
Home Values in the Area
Average Home Value in this Area
Purchase History
| Date | Buyer | Sale Price | Title Company |
|---|---|---|---|
| Wilson Marjorie | -- | -- | |
| Lightbourn Samuel | $132,000 | -- | |
| Parkes Karen | $118,200 | -- |
Source: Public Records
Mortgage History
| Date | Status | Borrower | Loan Amount |
|---|---|---|---|
| Previous Owner | Lightbourn Samuel | $131,288 | |
| Previous Owner | Parkes Karen | $108,742 |
Source: Public Records
Tax History Compared to Growth
Tax History
| Year | Tax Paid | Tax Assessment Tax Assessment Total Assessment is a certain percentage of the fair market value that is determined by local assessors to be the total taxable value of land and additions on the property. | Land | Improvement |
|---|---|---|---|---|
| 2025 | $3,382 | $103,920 | $16,000 | $87,920 |
| 2024 | $3,634 | $106,880 | $16,000 | $90,880 |
| 2023 | $3,634 | $103,560 | $16,000 | $87,560 |
| 2022 | $2,954 | $88,240 | $4,680 | $83,560 |
| 2021 | $2,123 | $64,120 | $4,680 | $59,440 |
| 2020 | $1,920 | $58,080 | $4,680 | $53,400 |
| 2019 | $1,844 | $56,440 | $4,680 | $51,760 |
| 2018 | $1,379 | $48,880 | $4,680 | $44,200 |
| 2017 | $1,568 | $46,840 | $4,680 | $42,160 |
| 2016 | $1,292 | $39,920 | $4,680 | $35,240 |
| 2014 | $997 | $31,360 | $4,680 | $26,680 |
Source: Public Records
Map
Nearby Homes
- 5813 Wellborn Oaks Ct
- 2373 Wellborn Hills Ct
- 5805 Marbut Rd
- 5822 Cedar Croft Ln
- 5537 Wellborn Creek Dr
- 5812 Wind Gate Ln
- 5734 Wellborn Oaks Ct
- 2357 Wellborn Hills Place
- 5739 Windfall Ln
- 5869 Strathmoor Manor Cir
- 2237 Wind Rose Ct
- 5547 Strathmoor Manor Cir
- 2089 Quilt Ct
- 5737 Strathmoor Manor Cir
- 5897 Strathmoor Manor Cir Unit I
- 5876 Old Wellborn Trace
- 2289 Strathmoor Manor Dr
- Pearson Plan at Wellington Park
- 2420 Briar Knoll Rd
- 2202 Lowtrail Ct
- 5729 Cedar Croft Ln
- 5743 Cedar Croft Ln
- 5721 Cedar Croft Ln Unit 3
- 5747 Cedar Croft Ln Unit 3
- 5700 Wellborn Creek Dr
- 5717 Cedar Croft Ln
- 5692 Wellborn Creek Dr Unit 2
- 2179 Silver Thorn Ct Unit 3
- 5706 Wellborn Creek Dr
- 5753 Cedar Croft Ln Unit 4
- 5852 Wellborn Oaks Ct Unit 2
- 2184 Silver Thorn Ct
- 5711 Cedar Croft Ln Unit 2
- 5712 Wellborn Creek Dr
- 5684 Wellborn Creek Dr
- 2169 Silver Thorn Ct
- 5757 Cedar Croft Ln
- 5851 Wellborn Oaks Ct Unit 2
- 2180 Silver Thorn Ct
- 5707 Cedar Croft Ln Unit 2