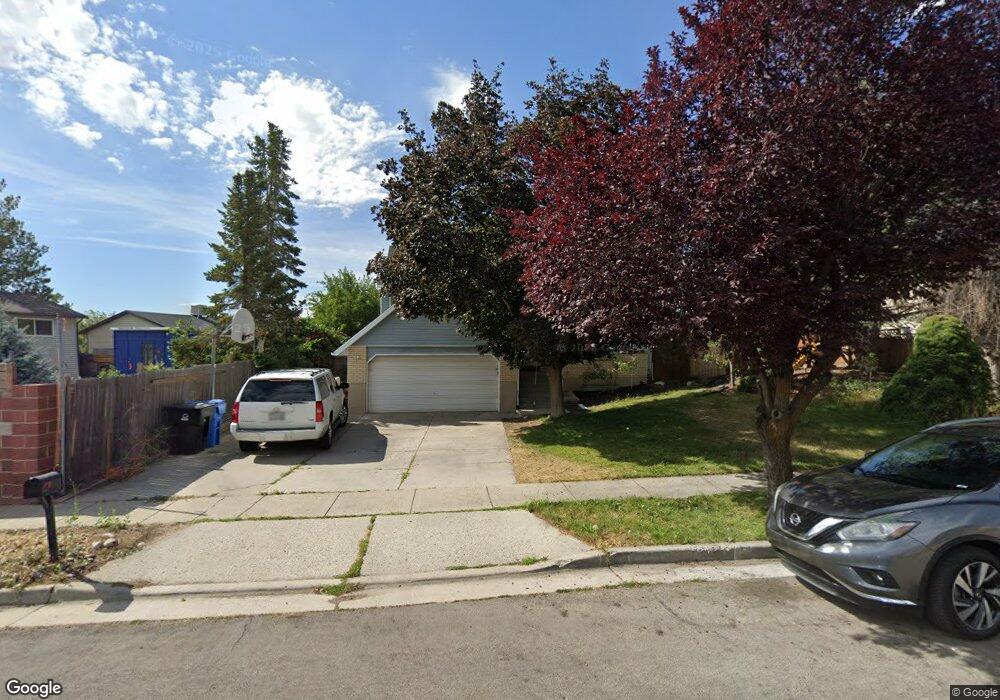
5737 W Corentine Cir Salt Lake City, UT 84118
Estimated Value: $429,000 - $473,000
4
Beds
2
Baths
1,774
Sq Ft
$258/Sq Ft
Est. Value
About This Home
This home is located at 5737 W Corentine Cir, Salt Lake City, UT 84118 and is currently estimated at $456,981, approximately $257 per square foot. 5737 W Corentine Cir is a home located in Salt Lake County with nearby schools including Thomas W Bacchus School, Thomas Jefferson Jr High School, and Kearns High School.
Ownership History
Date
Name
Owned For
Owner Type
Purchase Details
Closed on
Oct 29, 2021
Sold by
Ledesma Paul A and Ledesma Pamela O
Bought by
Gonzalez Lorenzo Brieno
Current Estimated Value
Home Financials for this Owner
Home Financials are based on the most recent Mortgage that was taken out on this home.
Original Mortgage
$411,803
Outstanding Balance
$376,340
Interest Rate
2.8%
Mortgage Type
FHA
Estimated Equity
$80,641
Purchase Details
Closed on
Nov 25, 2009
Sold by
Jensen Blake and Jensen Janet
Bought by
Ledesma Paul A and Ledesma Pamela O
Home Financials for this Owner
Home Financials are based on the most recent Mortgage that was taken out on this home.
Original Mortgage
$165,740
Interest Rate
4.88%
Mortgage Type
FHA
Purchase Details
Closed on
Sep 17, 1998
Sold by
Thomas David L and Thomas Kathy L
Bought by
Jensen Blake and Jensen Janet
Home Financials for this Owner
Home Financials are based on the most recent Mortgage that was taken out on this home.
Original Mortgage
$106,000
Interest Rate
6.89%
Create a Home Valuation Report for This Property
The Home Valuation Report is an in-depth analysis detailing your home's value as well as a comparison with similar homes in the area
Home Values in the Area
Average Home Value in this Area
Purchase History
| Date | Buyer | Sale Price | Title Company |
|---|---|---|---|
| Gonzalez Lorenzo Brieno | -- | First American Title | |
| Ledesma Paul A | -- | Equity Title | |
| Jensen Blake | -- | -- |
Source: Public Records
Mortgage History
| Date | Status | Borrower | Loan Amount |
|---|---|---|---|
| Open | Gonzalez Lorenzo Brieno | $411,803 | |
| Previous Owner | Ledesma Paul A | $165,740 | |
| Previous Owner | Jensen Blake | $106,000 |
Source: Public Records
Tax History Compared to Growth
Tax History
| Year | Tax Paid | Tax Assessment Tax Assessment Total Assessment is a certain percentage of the fair market value that is determined by local assessors to be the total taxable value of land and additions on the property. | Land | Improvement |
|---|---|---|---|---|
| 2025 | $3,262 | $447,300 | $112,600 | $334,700 |
| 2024 | $3,262 | $420,700 | $106,000 | $314,700 |
| 2023 | $2,982 | $384,300 | $101,900 | $282,400 |
| 2022 | $3,078 | $400,100 | $99,900 | $300,200 |
| 2021 | $2,807 | $307,800 | $76,900 | $230,900 |
| 2020 | $2,510 | $255,000 | $70,200 | $184,800 |
| 2019 | $2,401 | $242,800 | $70,200 | $172,600 |
| 2018 | $2,329 | $223,800 | $70,200 | $153,600 |
| 2017 | $1,946 | $207,000 | $65,900 | $141,100 |
| 2016 | $1,944 | $195,400 | $65,900 | $129,500 |
| 2015 | $1,723 | $173,400 | $79,500 | $93,900 |
| 2014 | $1,687 | $172,500 | $79,500 | $93,000 |
Source: Public Records
Map
Nearby Homes
- 5751 W Chantilly Cir
- 5818 W Plumbago Ave
- 5733 W Plumbago Ave
- 5563 S Copper City Dr
- 5586 W Highwood Dr
- 5680 W Pelican Ridge Ln
- 5674 W Pelican Ridge Ln
- 5716 Trowbridge Way
- 5929 W Dry Bone Cir
- 5441 W 5440 S
- 5663 S China Clay Cir
- 5278 S Kemp Dr
- 5242 S Hamlet Cir
- 5386 Silvertip Dr
- 5633 W Coral Mount Ln
- 5418 W Stony Vista Dr
- 5749 S Mirador Ct
- 5927 S 5665 W
- 5888 S Stone Bluff Way
- 5281 S Leprechaun Ln
- 5737 Corentine Cir
- 5749 Corentine Cir
- 5749 W Corentine Cir
- 5516 S Le Chateau Way
- 5516 Le Chateau Way
- 5530 Le Chateau Way
- 5738 Dale Amour Dr
- 5738 W Dale Amour Drive Dr S
- 5750 W Dale Amour Dr
- 5750 Dale Amour Dr
- 5736 Corentine Cir
- 5726 Dale Amour Dr
- 5726 W Dale Amour Dr
- 5759 W Corentine Cir
- 5759 Corentine Cir
- 5748 W Corentine Cir
- 5748 Corentine Cir
- 5728 Corentine Cir
- 5760 Dale Amour Dr
- 5758 Corentine Cir