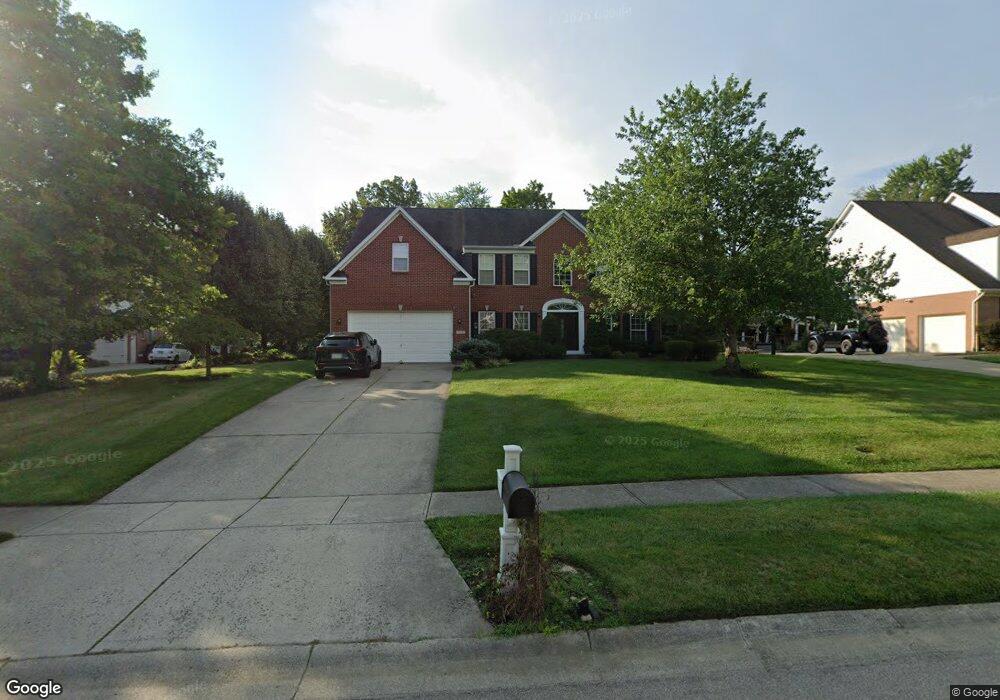
5738 Cleathill Dr Loveland, OH 45140
Outer Loveland NeighborhoodEstimated Value: $591,000 - $647,000
5
Beds
3
Baths
3,811
Sq Ft
$160/Sq Ft
Est. Value
About This Home
This home is located at 5738 Cleathill Dr, Loveland, OH 45140 and is currently estimated at $609,665, approximately $159 per square foot. 5738 Cleathill Dr is a home located in Clermont County with nearby schools including Milford Senior High School, Milford Christian Academy, and St. Andrew - St. Elizabeth Ann Seton School.
Ownership History
Date
Name
Owned For
Owner Type
Purchase Details
Closed on
Feb 27, 2009
Sold by
Paquette Woods Kathleen and Woods Antony
Bought by
Cheung Timmy and Ni Qin Yin
Current Estimated Value
Home Financials for this Owner
Home Financials are based on the most recent Mortgage that was taken out on this home.
Original Mortgage
$203,000
Outstanding Balance
$128,806
Interest Rate
5.09%
Mortgage Type
Purchase Money Mortgage
Estimated Equity
$480,859
Purchase Details
Closed on
Mar 24, 2005
Sold by
Paquette Thomas
Bought by
Paquette Kathleen
Purchase Details
Closed on
Jul 17, 2000
Sold by
N V R Inc
Bought by
Paquette Thomas and Paquette Kathleen
Home Financials for this Owner
Home Financials are based on the most recent Mortgage that was taken out on this home.
Original Mortgage
$282,160
Interest Rate
8.55%
Mortgage Type
New Conventional
Purchase Details
Closed on
Mar 31, 2000
Sold by
Bramblewood Dev Inc
Bought by
N V R Inc
Create a Home Valuation Report for This Property
The Home Valuation Report is an in-depth analysis detailing your home's value as well as a comparison with similar homes in the area
Home Values in the Area
Average Home Value in this Area
Purchase History
| Date | Buyer | Sale Price | Title Company |
|---|---|---|---|
| Cheung Timmy | $283,000 | Attorney | |
| Paquette Kathleen | -- | -- | |
| Paquette Thomas | $280,160 | -- | |
| N V R Inc | $49,000 | -- |
Source: Public Records
Mortgage History
| Date | Status | Borrower | Loan Amount |
|---|---|---|---|
| Open | Cheung Timmy | $203,000 | |
| Previous Owner | Paquette Thomas | $282,160 |
Source: Public Records
Tax History Compared to Growth
Tax History
| Year | Tax Paid | Tax Assessment Tax Assessment Total Assessment is a certain percentage of the fair market value that is determined by local assessors to be the total taxable value of land and additions on the property. | Land | Improvement |
|---|---|---|---|---|
| 2024 | $7,034 | $152,500 | $26,600 | $125,900 |
| 2023 | $7,106 | $152,500 | $26,600 | $125,900 |
| 2022 | $6,859 | $113,270 | $19,780 | $93,490 |
| 2021 | $6,866 | $113,270 | $19,780 | $93,490 |
| 2020 | $6,581 | $113,270 | $19,780 | $93,490 |
| 2019 | $7,398 | $119,670 | $19,670 | $100,000 |
| 2018 | $7,400 | $119,670 | $19,670 | $100,000 |
| 2017 | $6,873 | $119,670 | $19,670 | $100,000 |
| 2016 | $6,958 | $102,270 | $16,800 | $85,470 |
| 2015 | $6,412 | $102,270 | $16,800 | $85,470 |
| 2014 | $6,412 | $102,270 | $16,800 | $85,470 |
| 2013 | $6,175 | $95,520 | $17,500 | $78,020 |
Source: Public Records
Map
Nearby Homes
- 5933 Firm Stance Dr
- 1140 Weber Rd
- 6379 Derbyshire Ln
- 2013 Weber Rd
- 1513 Charleston Ln
- 1064 Weber Rd
- 1803 Wheatfield Way
- 6141 Brandywine Ct
- 6149 Century Farm Dr
- 1124 Clover Field Dr
- 1113 Clover Field Dr
- 6211 Spires Dr
- 6211 Cook Rd
- 6661 Paxton Guinea Rd
- 6365 Ironwood Dr
- 6108 Donna Jay Dr
- 6320 Ashford Dr
- 1331 Harbor Cove
- 945 Paul Vista Dr
- 6647 Saddleback Way
- 5736 Cleathill Dr
- 5740 Cleathill Dr
- 5734 Cleathill Dr
- 5844 Irish Dude Dr
- 5842 Irish Dude Dr
- 5742 Cleathill Dr
- 5846 Irish Dude Dr
- 5848 Irish Dude Dr
- 5737 Cleathill Dr
- 5735 Cleathill Dr
- 5850 Irish Dude Dr
- 5741 Cleathill Dr
- 5739 Cleathill Dr
- 5840 Irish Dude Dr
- 5733 Cleathill Dr
- 5732 Cleathill Dr
- 955 Palomar Dr
- 5852 Irish Dude Dr
- 953 Ashire Ct
- 953 Palomar Dr