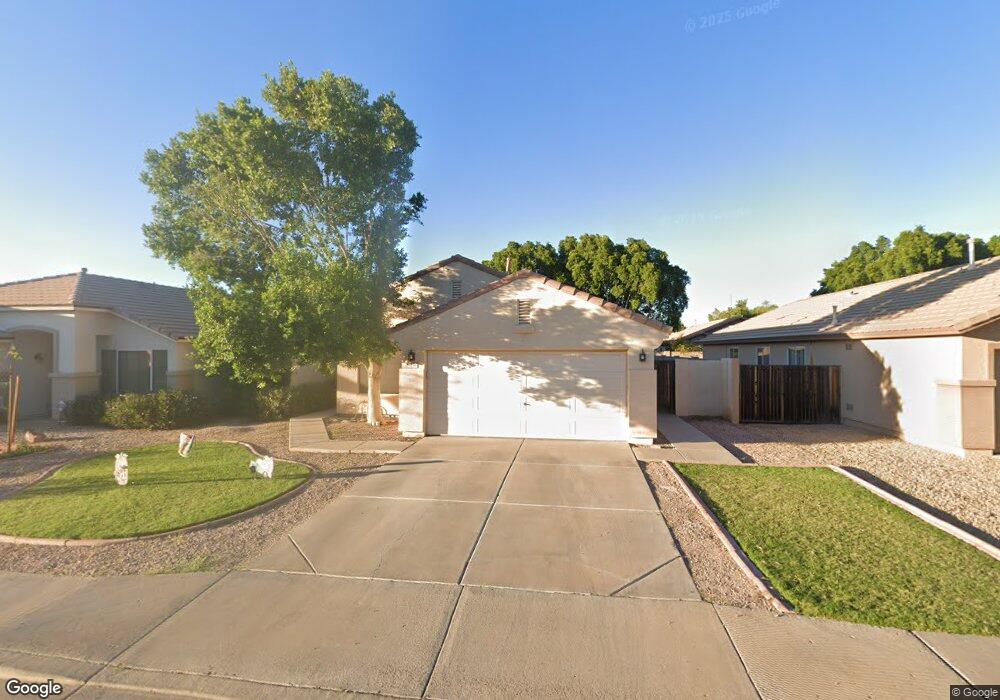
5738 E Grove Cir Mesa, AZ 85206
Central Mesa NeighborhoodEstimated Value: $389,659 - $444,000
--
Bed
2
Baths
1,289
Sq Ft
$324/Sq Ft
Est. Value
About This Home
This home is located at 5738 E Grove Cir, Mesa, AZ 85206 and is currently estimated at $417,165, approximately $323 per square foot. 5738 E Grove Cir is a home located in Maricopa County with nearby schools including Franklin at Brimhall Elementary School, Wilson Elementary School, and Franklin West Elementary School.
Ownership History
Date
Name
Owned For
Owner Type
Purchase Details
Closed on
Jun 29, 2012
Sold by
Stephens Aubree Petersen
Bought by
Stephens Mark and Stephens Aubree
Current Estimated Value
Purchase Details
Closed on
Feb 24, 2003
Sold by
Garza Eloy H and Garza Keri
Bought by
Petersen Aubree
Home Financials for this Owner
Home Financials are based on the most recent Mortgage that was taken out on this home.
Original Mortgage
$108,000
Outstanding Balance
$46,327
Interest Rate
5.85%
Mortgage Type
FHA
Estimated Equity
$370,838
Purchase Details
Closed on
Mar 30, 1998
Sold by
Fulton Homes Sales Corp
Bought by
Garza Eloy H and Garza Keri
Home Financials for this Owner
Home Financials are based on the most recent Mortgage that was taken out on this home.
Original Mortgage
$108,742
Interest Rate
7%
Mortgage Type
FHA
Create a Home Valuation Report for This Property
The Home Valuation Report is an in-depth analysis detailing your home's value as well as a comparison with similar homes in the area
Home Values in the Area
Average Home Value in this Area
Purchase History
| Date | Buyer | Sale Price | Title Company |
|---|---|---|---|
| Stephens Mark | -- | None Available | |
| Petersen Aubree | $135,000 | Transnation Title Insurance | |
| Garza Eloy H | $109,472 | Security Title Agency | |
| Fulton Homes Sales Corp | $60,949 | Security Title Agency |
Source: Public Records
Mortgage History
| Date | Status | Borrower | Loan Amount |
|---|---|---|---|
| Open | Petersen Aubree | $108,000 | |
| Previous Owner | Garza Eloy H | $108,742 |
Source: Public Records
Tax History Compared to Growth
Tax History
| Year | Tax Paid | Tax Assessment Tax Assessment Total Assessment is a certain percentage of the fair market value that is determined by local assessors to be the total taxable value of land and additions on the property. | Land | Improvement |
|---|---|---|---|---|
| 2025 | $1,613 | $16,086 | -- | -- |
| 2024 | $1,618 | $15,320 | -- | -- |
| 2023 | $1,618 | $28,400 | $5,680 | $22,720 |
| 2022 | $1,585 | $21,980 | $4,390 | $17,590 |
| 2021 | $1,600 | $20,510 | $4,100 | $16,410 |
| 2020 | $1,578 | $18,480 | $3,690 | $14,790 |
| 2019 | $1,476 | $15,610 | $3,120 | $12,490 |
| 2018 | $1,416 | $14,600 | $2,920 | $11,680 |
| 2017 | $1,374 | $14,300 | $2,860 | $11,440 |
| 2016 | $1,343 | $13,560 | $2,710 | $10,850 |
| 2015 | $1,266 | $12,680 | $2,530 | $10,150 |
Source: Public Records
Map
Nearby Homes
- 5761 E Garnet Ave
- 5836 E Hampton Ave
- 5648 E Holmes Ave
- 5855 E Hopi Cir
- 5520 E Holmes Ave
- 5718 E Flower Cir
- 6001 E Southern Ave Unit 80
- 5512 E Holmes Ave
- 5413 E Garnet Ave
- 2474 Leisure World
- 2461 Leisure World
- 2350 Leisure World
- 5215 E Southern Ave
- 2273 Leisure World
- 2445 Leisure World
- 1345 Leisure World
- 1475 Leisure World
- 1318 Leisure World
- 1505 Leisure World
- 1612 Leisure World
- 5744 E Grove Cir
- 5732 E Grove Cir
- 5750 E Grove Cir
- 5726 E Grove Cir
- 5737 E Glade Ave
- 5731 E Glade Ave
- 5756 E Grove Cir
- 5725 E Glade Ave
- 5745 E Glade Ave
- 5737 E Grove Cir
- 5731 E Grove Cir
- 5743 E Grove Cir
- 5725 E Grove Cir
- 5762 E Grove Cir
- 5749 E Grove Cir
- 5749 E Glade Ave
- 5755 E Grove Cir
- 1328 S Sandal
- 1322 S Sandal
- 5757 E Glade Ave