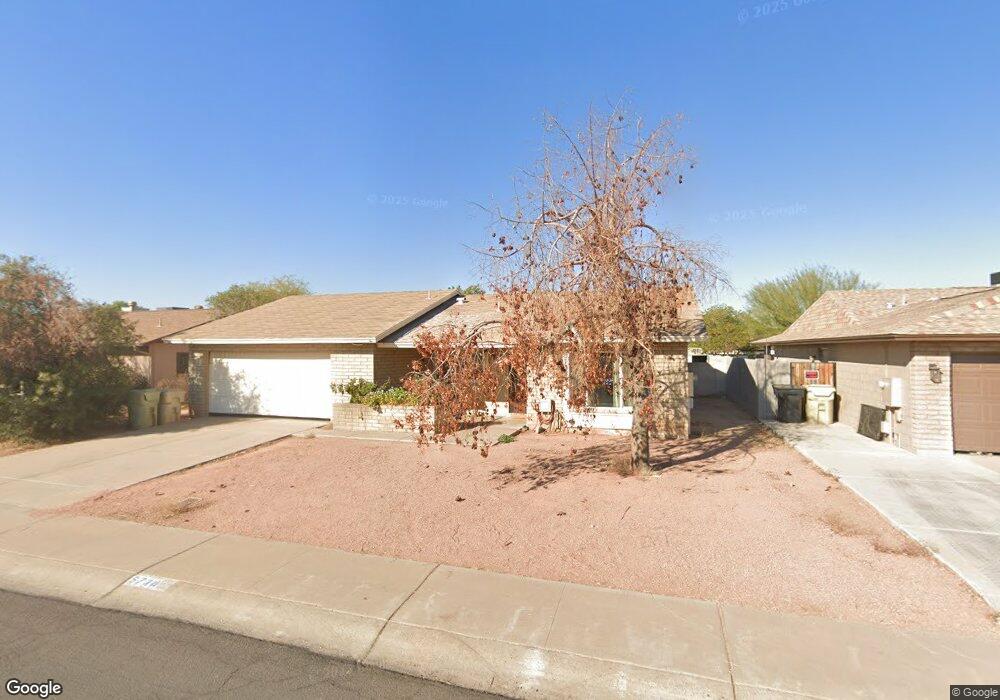
5738 W Mescal St Unit 8 Glendale, AZ 85304
Estimated Value: $338,000 - $406,000
4
Beds
2
Baths
1,562
Sq Ft
$239/Sq Ft
Est. Value
About This Home
This home is located at 5738 W Mescal St Unit 8, Glendale, AZ 85304 and is currently estimated at $373,937, approximately $239 per square foot. 5738 W Mescal St Unit 8 is a home located in Maricopa County with nearby schools including Desert Palms Elementary School and Ironwood High School.
Ownership History
Date
Name
Owned For
Owner Type
Purchase Details
Closed on
Sep 23, 2011
Sold by
Federal National Mortgage Association
Bought by
Muminovic Fahrudin Fyco and Muminovic Amela
Current Estimated Value
Home Financials for this Owner
Home Financials are based on the most recent Mortgage that was taken out on this home.
Original Mortgage
$65,200
Outstanding Balance
$44,198
Interest Rate
4.05%
Mortgage Type
New Conventional
Estimated Equity
$329,739
Purchase Details
Closed on
Jul 6, 2011
Sold by
Bowen Tami
Bought by
Federal National Mortgage Association
Purchase Details
Closed on
Feb 15, 2005
Sold by
Bowen James B
Bought by
Bowen Tami
Home Financials for this Owner
Home Financials are based on the most recent Mortgage that was taken out on this home.
Original Mortgage
$141,300
Interest Rate
6.4%
Mortgage Type
New Conventional
Create a Home Valuation Report for This Property
The Home Valuation Report is an in-depth analysis detailing your home's value as well as a comparison with similar homes in the area
Home Values in the Area
Average Home Value in this Area
Purchase History
| Date | Buyer | Sale Price | Title Company |
|---|---|---|---|
| Muminovic Fahrudin Fyco | $81,500 | First American Title Ins Co | |
| Federal National Mortgage Association | $197,941 | Accommodation | |
| Bowen Tami | -- | Dynasty Title Agency Llc |
Source: Public Records
Mortgage History
| Date | Status | Borrower | Loan Amount |
|---|---|---|---|
| Open | Muminovic Fahrudin Fyco | $65,200 | |
| Previous Owner | Bowen Tami | $141,300 |
Source: Public Records
Tax History Compared to Growth
Tax History
| Year | Tax Paid | Tax Assessment Tax Assessment Total Assessment is a certain percentage of the fair market value that is determined by local assessors to be the total taxable value of land and additions on the property. | Land | Improvement |
|---|---|---|---|---|
| 2025 | $1,104 | $12,079 | -- | -- |
| 2024 | $1,121 | $11,503 | -- | -- |
| 2023 | $1,121 | $26,400 | $5,280 | $21,120 |
| 2022 | $1,110 | $20,170 | $4,030 | $16,140 |
| 2021 | $1,165 | $18,460 | $3,690 | $14,770 |
| 2020 | $1,178 | $17,170 | $3,430 | $13,740 |
| 2019 | $1,147 | $15,460 | $3,090 | $12,370 |
| 2018 | $1,122 | $14,200 | $2,840 | $11,360 |
| 2017 | $1,125 | $12,780 | $2,550 | $10,230 |
| 2016 | $1,116 | $12,070 | $2,410 | $9,660 |
| 2015 | $1,043 | $11,700 | $2,340 | $9,360 |
Source: Public Records
Map
Nearby Homes
- 5651 W Mescal St
- 10820 N 57th Dr
- 11227 N 59th Dr
- 5633 W Saguaro Dr
- 5674 W North Ln
- 10803 N 55th Ave
- 5865 W North Ln
- 10227 N 56th Dr
- 5407 W North Ln
- 11840 N 59th Ln
- 5534 W Riviera Dr
- 5432 W Sunnyside Dr
- 10608 N 53rd Cir
- 10345 N 62nd Ave
- 11051 N 53rd Ave
- 5323 W North Ln
- 5236 W Peoria Ave Unit 202
- 5753 W Onyx Ave
- 6319 W Mercer Ln
- 5214 W Cholla St
- 5732 W Mescal St
- 5744 W Mescal St
- 5735 W Shangri la Rd
- 5741 W Shangri la Rd Unit 8
- 5729 W Shangri la Rd
- 5726 W Mescal St
- 5750 W Mescal St Unit n/a
- 5750 W Mescal St
- 5739 W Mescal St
- 5723 W Shangri la Rd
- 5747 W Shangri la Rd Unit 8
- 5745 W Mescal St
- 5733 W Mescal St
- 5756 W Mescal St Unit 8
- 5727 W Mescal St
- 5751 W Mescal St
- 5753 W Shangri la Rd
- 5757 W Mescal St
- 5740 W Desert Cove Ave
- 5804 W Mescal St