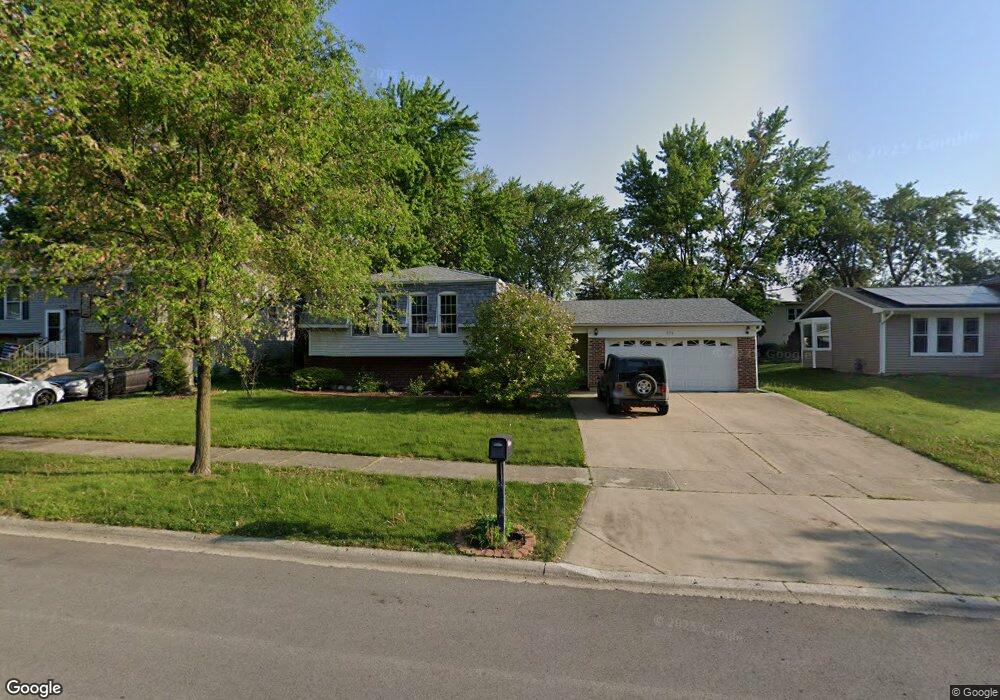
574 Buckingham Way Bolingbrook, IL 60440
West 83rd NeighborhoodEstimated Value: $384,000 - $450,000
Studio
--
Bath
1,606
Sq Ft
$254/Sq Ft
Est. Value
About This Home
This home is located at 574 Buckingham Way, Bolingbrook, IL 60440 and is currently estimated at $407,201, approximately $253 per square foot. 574 Buckingham Way is a home located in DuPage County with nearby schools including William F. Murphy Elementary School, Thomas Jefferson Junior High School, and Downers Grove South High School.
Ownership History
Date
Name
Owned For
Owner Type
Purchase Details
Closed on
Dec 10, 2013
Sold by
Asba Llc
Bought by
Bama Llc
Current Estimated Value
Purchase Details
Closed on
Aug 27, 2009
Sold by
The Richardson Properties Lp
Bought by
Asba Llc
Purchase Details
Closed on
Jan 10, 2007
Sold by
Richardson Al and Richardson Michele
Bought by
The Richardson Properties Lp
Purchase Details
Closed on
Jul 17, 2002
Sold by
St Francisville Llc
Bought by
Richardson Al and Richardson Marlene
Home Financials for this Owner
Home Financials are based on the most recent Mortgage that was taken out on this home.
Original Mortgage
$139,500
Interest Rate
5.5%
Purchase Details
Closed on
Feb 8, 2002
Sold by
Collins Dina M and Case #00 Ch 1471
Bought by
St Francisville Llc and Nationscredit Home Equity Services Corp
Purchase Details
Closed on
Mar 27, 1998
Sold by
Gardiner Homer E and Gardiner Barbara A
Bought by
Collins Dina M
Create a Home Valuation Report for This Property
The Home Valuation Report is an in-depth analysis detailing your home's value as well as a comparison with similar homes in the area
Home Values in the Area
Average Home Value in this Area
Purchase History
| Date | Buyer | Sale Price | Title Company |
|---|---|---|---|
| Bama Llc | -- | Attorney | |
| Asba Llc | -- | None Available | |
| The Richardson Properties Lp | -- | None Available | |
| Richardson Al | $175,000 | -- | |
| St Francisville Llc | -- | -- | |
| Collins Dina M | $160,000 | Intercounty Title |
Source: Public Records
Mortgage History
| Date | Status | Borrower | Loan Amount |
|---|---|---|---|
| Previous Owner | Richardson Al | $139,500 |
Source: Public Records
Tax History
| Year | Tax Paid | Tax Assessment Tax Assessment Total Assessment is a certain percentage of the fair market value that is determined by local assessors to be the total taxable value of land and additions on the property. | Land | Improvement |
|---|---|---|---|---|
| 2024 | $10,027 | $122,412 | $56,155 | $66,257 |
| 2023 | $8,894 | $111,120 | $51,250 | $59,870 |
| 2022 | $8,246 | $101,020 | $46,590 | $54,430 |
| 2021 | $7,880 | $97,200 | $44,830 | $52,370 |
| 2020 | $7,730 | $95,450 | $44,020 | $51,430 |
| 2019 | $7,551 | $91,330 | $42,120 | $49,210 |
| 2018 | $7,259 | $85,710 | $39,530 | $46,180 |
| 2017 | $7,046 | $82,820 | $38,200 | $44,620 |
| 2016 | $6,983 | $79,830 | $36,820 | $43,010 |
| 2015 | $7,042 | $76,750 | $35,400 | $41,350 |
| 2014 | $7,559 | $80,790 | $37,260 | $43,530 |
| 2013 | $7,413 | $80,980 | $37,350 | $43,630 |
Source: Public Records
Map
Nearby Homes
- 3599 Kennedy Ln Unit 14001
- 668 Londonberry Ln
- 704 N Pinecrest Rd
- 1078 Rain Tree Dr
- 519 Charlestown Dr
- 333 Grosvenor Ct
- 2505 Spring St Unit 3304
- 2220 Wharf Dr Unit 1901
- 8505 Woodward Ave Unit 201
- 853 Bonnie Brae Ln
- 836 Bonnie Brae Ln
- 411 Assembly Dr
- 8484 Liberty Ln
- 8540 Chadwick Ct
- 8544 Chadwick Ct
- 8528 Chadwick Ct
- 1886 Fulton St
- 8146 Hampton Dr
- 1882 Fulton St
- 8537 Chadwick Ct
- 578 Buckingham Way
- 570 Buckingham Way
- 577 Cambridge Way
- 573 Cambridge Way
- 581 Cambridge Way
- 582 Buckingham Way
- 566 Buckingham Way
- 573 Buckingham Way
- 569 Cambridge Way
- 569 Buckingham Way
- 585 Cambridge Way
- 577 Buckingham Way
- 562 Buckingham Way
- 586 Buckingham Way
- 565 Cambridge Way
- 581 Buckingham Way
- 565 Buckingham Way
- 589 Cambridge Way Unit 6
- 578 Cambridge Way
- 561 Buckingham Way
Your Personal Tour Guide
Ask me questions while you tour the home.